Download PDF
Translations (PDF)
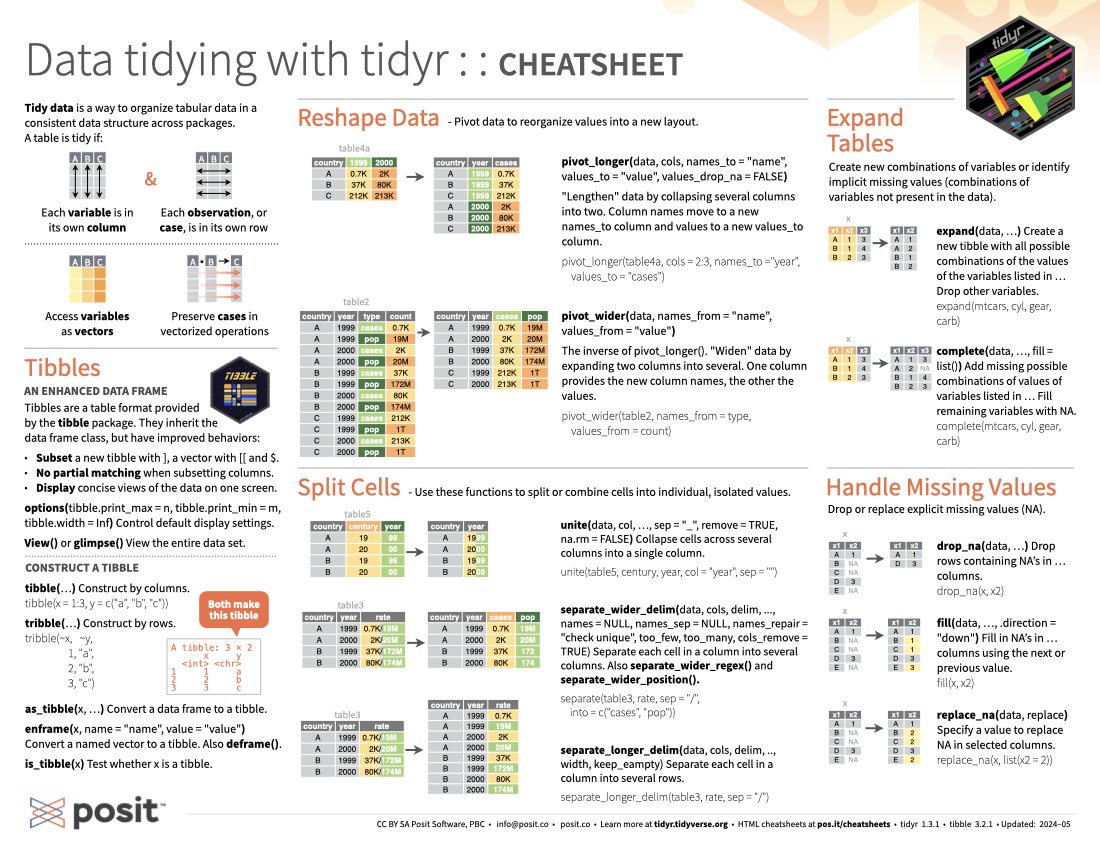
Tidy data is a way to organize tabular data in a consistent data structure across packages. A table is tidy if:
library(tidyr)
library(tibble)
Tibbles are a table format provided by the tibble package. They inherit the data frame class, but have improved behaviors:
Subset a new tibble with ], a vector with [[ and $.
No partial matching when subsetting columns.
Display concise views of the data on one screen.
options(tibble.print_max = n, tibble.print_min = m, tibble.width = Inf): Control default display settings.
View() or glimpse(): View the entire data set.
tibble(...): Construct by columns.
tibble(
  x = 1:3,
  y = c("a", "b", "c")
)
# A tibble: 3 × 2
x y
<int> <chr>
1 1 a
2 2 b
3 3 c tribble(...): Construct by rows.
tribble(
  ~x, ~y,
   1, "a",
   2, "b",
   3, "c"
)
as_tibble(x, ...): Convert a data frame to a tibble.
enframe(x, name = "name", value = "value"): Convert a named vector to a tibble. Also deframe().
is_tibble(x): Test whether x is a tibble.
Pivot data to reorganize values into a new layout.
pivot_longer(data, cols, name_to = "name", values_to = "value", values_drop_na = FALSE): “Lengthen” data by collapsing several columns into two.
table4a looks like the following:table4a# A tibble: 3 × 3
country `1999` `2000`
<chr> <dbl> <dbl>
1 Afghanistan 745 2666
2 Brazil 37737 80488
3 China 212258 213766names_to column and values to a new values_to column. The output of pivot_longer() will look like the following:pivot_longer(table4a, cols = 2:3, names_to = "year", values_to = "cases")# A tibble: 6 × 3
country year cases
<chr> <chr> <dbl>
1 Afghanistan 1999 745
2 Afghanistan 2000 2666
3 Brazil 1999 37737
4 Brazil 2000 80488
5 China 1999 212258
6 China 2000 213766pivot_wider(data, name_from = "name", values_from = "value"): The inverse of pivot_longer(). “Widen” data by expanding two columns into several.
table2 looks like the following:table2# A tibble: 12 × 4
country year type count
<chr> <dbl> <chr> <dbl>
1 Afghanistan 1999 cases 745
2 Afghanistan 1999 population 19987071
3 Afghanistan 2000 cases 2666
4 Afghanistan 2000 population 20595360
5 Brazil 1999 cases 37737
6 Brazil 1999 population 172006362
7 Brazil 2000 cases 80488
8 Brazil 2000 population 174504898
9 China 1999 cases 212258
10 China 1999 population 1272915272
11 China 2000 cases 213766
12 China 2000 population 1280428583pivot_wider() will look like the following:pivot_wider(table2, names_from = type, values_from = count)# A tibble: 6 × 4
country year cases population
<chr> <dbl> <dbl> <dbl>
1 Afghanistan 1999 745 19987071
2 Afghanistan 2000 2666 20595360
3 Brazil 1999 37737 172006362
4 Brazil 2000 80488 174504898
5 China 1999 212258 1272915272
6 China 2000 213766 1280428583Use these functions to split or combine cells into individual, isolated values.
unite(data, col, ..., sep = "_", remove = TRUE, na.rm = FALSE): Collapse cells across several columns into a single column.
table5 looks like the following:table5# A tibble: 6 × 4
country century year rate
<chr> <chr> <chr> <chr>
1 Afghanistan 19 99 745/19987071
2 Afghanistan 20 00 2666/20595360
3 Brazil 19 99 37737/172006362
4 Brazil 20 00 80488/174504898
5 China 19 99 212258/1272915272
6 China 20 00 213766/1280428583unite() will look like the following:unite(table5, century, year, col = "year", sep = "")# A tibble: 6 × 3
country year rate
<chr> <chr> <chr>
1 Afghanistan 1999 745/19987071
2 Afghanistan 2000 2666/20595360
3 Brazil 1999 37737/172006362
4 Brazil 2000 80488/174504898
5 China 1999 212258/1272915272
6 China 2000 213766/1280428583separate_wider_delim(data, cols, delim, ..., names = NULL, names_sep = NULL, names_repair = "check unique", too_few, too_many, cols_remove = TRUE): Separate each cell in a column into several columns. Also extract().
table3 looks like the following:table3# A tibble: 6 × 3
country year rate
<chr> <dbl> <chr>
1 Afghanistan 1999 745/19987071
2 Afghanistan 2000 2666/20595360
3 Brazil 1999 37737/172006362
4 Brazil 2000 80488/174504898
5 China 1999 212258/1272915272
6 China 2000 213766/1280428583separate_wider_delim() will look like the following:separate_wider_delim(table3, rate, delim = "/", names = c("cases", "pop"))# A tibble: 6 × 4
country year cases pop
<chr> <dbl> <chr> <chr>
1 Afghanistan 1999 745 19987071
2 Afghanistan 2000 2666 20595360
3 Brazil 1999 37737 172006362
4 Brazil 2000 80488 174504898
5 China 1999 212258 1272915272
6 China 2000 213766 1280428583separate_longer_delim(data, cols, delim, .., width, keep_empty): Separate each cell in a column into several rows.
table3 looks like the following:table3# A tibble: 6 × 3
country year rate
<chr> <dbl> <chr>
1 Afghanistan 1999 745/19987071
2 Afghanistan 2000 2666/20595360
3 Brazil 1999 37737/172006362
4 Brazil 2000 80488/174504898
5 China 1999 212258/1272915272
6 China 2000 213766/1280428583separate_longer_delim() will look like the following:separate_longer_delim(table3, rate, delim = "/")# A tibble: 12 × 3
country year rate
<chr> <dbl> <chr>
1 Afghanistan 1999 745
2 Afghanistan 1999 19987071
3 Afghanistan 2000 2666
4 Afghanistan 2000 20595360
5 Brazil 1999 37737
6 Brazil 1999 172006362
7 Brazil 2000 80488
8 Brazil 2000 174504898
9 China 1999 212258
10 China 1999 1272915272
11 China 2000 213766
12 China 2000 1280428583Create new combinations of variables or identify implicit missing values (combinations of variables not present in the data).
expand(data, ...): Create a new tibble with all possible combinations of the values of the variables listed in … Drop other variables.
expand(mtcars, cyl, gear, carb)complete(data, ..., fill = list()): Add missing possible combinations of values of variables listed in … Fill remaining variables with NA.
complete(mtcars, cyl, gear, carb)Drop or replace explicit missing values (NA).
x <- tribble(
  ~x1, ~x2,
  "A",   1,
  "B",  NA,
  "C",  NA,
  "D",   3,
  "E",  NA
)
drop_na(data, ...): Drop rows containing NAs in … columns.
drop_na(x, x2)fill(data, ..., .direction = "down"): Fill in NAs in … columns using the next or previous value.
fill(x, x2)replace_na(data, replace): Specify a value to replace NA in selected columns.
replace_na(x, list(x2 = 2))A nested data frame stores individual tables as a list-column of data frames within a larger organizing data frame. List-columns can also be lists of vectors or lists of varying data types. Use a nested data frame to:
map(), map2(), or pmap() or with dplyr rowwise() grouping.nest(data, ...): Moves groups of cells into a list-column of a data frame. Use alone or with dplyr::group_by().Group the data frame with group_by() and use nest() to move the groups into a list-column.
n_storms <- storms |>
  group_by(name) |>
  nest()
Use nest(new_col = c(x,y)) to specify the columns to group using dplyr::select() syntax.
n_storms <- storms |>
  nest(data = c(year:long))
Index list-columns with [[]].
n_storms$data[[1]]tibble::tribble(...): Makes list-columns when needed.
tribble(
  ~max, ~seq,
     3,  1:3,
     4,  1:4,
     5,  1:5
)tibble::tibble(...): Saves list input as list-columns.
tibble(
  max = c(3,4,5),
  seq = list(1:3, 1:4, 1:5)
)
tibble::enframe(x, name = "name", value = "value"): Convert multi-level list to a tibble with list-cols.
enframe(list("3" = 1:3, "4" = 1:4, "5" = 1:5), "max", "seq")dplyr::mutate(), transmute(), and summarise() will output list-columns if they return a list.
mtcars |>
  group_by(cyl) |>
summarise(q = list(quantile(mpg)))unnest(data, cols, ..., keep_empty = FALSE): Flatten nested columns back to regular columns. The inverse of nest().
n_storms |> unnest(data)unnest_longer(data, col, values_to = NULL, indices_to = NULL): Turn each element of a list-column into a row.
starwars |>
  select(name, films) |>
  unnest_longer(films)
unnest_wider(data, col): Turn each element of a list-column into a regular column.
starwars |>
  select(name, films) |>
  unnest_wider(films, names_sep = "_")
hoist(.data, .col, ..., remove = TRUE): Selectively pull list components out into their own top-level columns. Uses purrr::pluck() syntax for selecting from lists.
starwars |>
  select(name, films) |>
hoist(films, first_film = 1, second_film = 2)A vectorized function takes a vector, transforms each element in parallel, and returns a vector of the same length. By themselves vectorized functions cannot work with lists, such as list-columns.
dplyr::rowwise(.data, ...): Group data so that each row is one group, and within the groups, elements of list-columns appear directly (accessed with [[), not as lists of length one. When you use rowwise(), dplyr functions will seem to apply functions to list-columns in a vectorized fashion.
Apply a function to a list-column and create a new list-column. In this example, dim() returns two values per row and so is wrapped with list() to tell mutate() to create a list-column.
n_storms |>
  rowwise() |>
  mutate(n = list(dim(data))) # dim() returns two values per row, wrap with list to tell mutate to create a list-column
Apply a function to a list-column and create a regular column. In this example, nrow() returns one integer per row.
n_storms |>
  rowwise() |>
  mutate(n = nrow(data)) # nrow() returns one integer per row
Collapse multiple list-columns into a single list-column. In this example, append() returns a list for each row, so col type must be list.
starwars |>
  rowwise() |>
  mutate(transport = list(append(vehicles, starships))) # append() returns a list for each row, so col type must be list
Apply a function to multiple list-columns. In this example, length() returns one integer per row.
starwars |>
  rowwise() |>
  mutate(n_transports = length(c(vehicles, starships)))
  # length() returns one integer per row
See purrr package for more list functions.
CC BY SA Posit Software, PBC • info@posit.co • posit.co
Learn more at tidyr.tidyverse.org.
Updated: 2024-05.
packageVersion("tidyr")[1] '1.3.1'packageVersion("tibble")[1] '3.2.1'