List of compatible HTML widgets
This page lists some HTML widgets that are compatible with Crosstalk.
(To add a widget, please submit a PR with modifications to this page.)
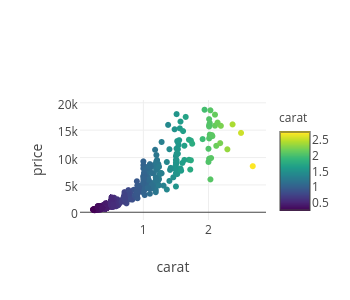
Plotly
Author: Carson Sievert
Plotly is a general purpose plotting library that outputs interactive web graphics using plotly.js.
install.packages("plotly")
Leaflet
Author: RStudio
Leaflet lets you easily generate interactive maps using R. It is a wrapper for the very popular Leaflet JavaScript library by Vladamir Agafonkin.
install.packages("leaflet")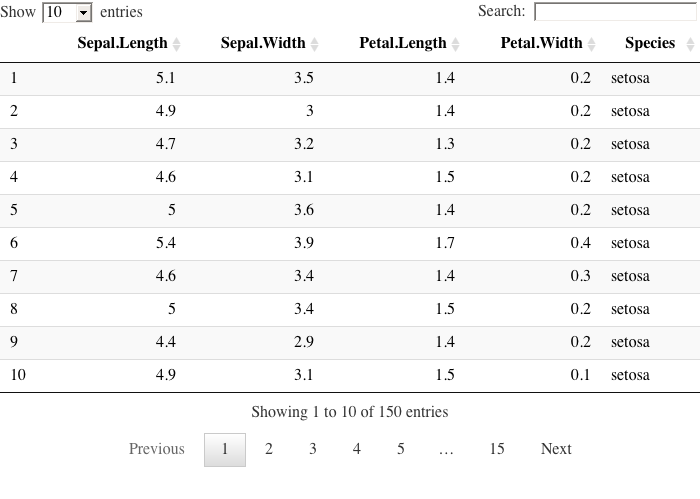
DT
Author: RStudio
DT is a highly customizable data table library. It wraps the DataTables plug-in for jQuery.
install.packages("DT")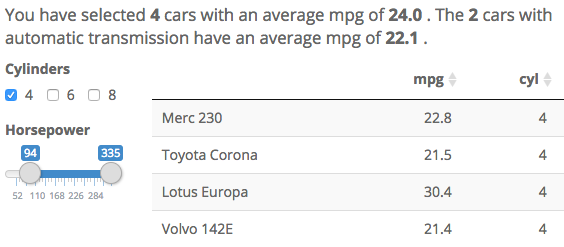
SummaryWidget
Author: Kent Johnson
A SummaryWidget displays a single summary statistic that updates when the Crosstalk selection changes. A SummaryWidget displays the count, sum or mean of one column of selected data.
devtools::install_github("kent37/summarywidget")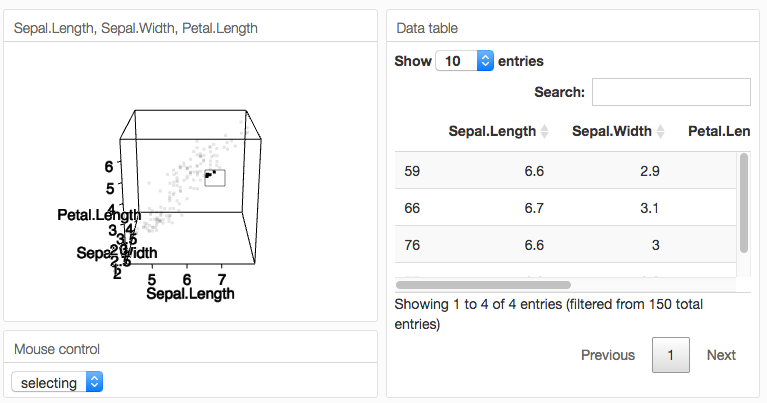
rgl
Author: Duncan Murdoch and Daniel Adler
rgl is a 3D visualization system based on OpenGL. It provides a
medium to high level interface for use in R, currently modelled on
classic R graphics, with extensions to allow for interaction. See the
?rgl::rglShared help topic for details of
crosstalk usage.
install.packages("rgl")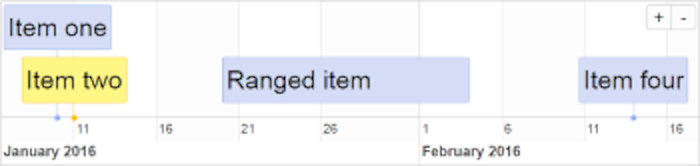
timevis
Author: Dean Attali
timevis lets you create interactive timeline
visualizations in R. This package is based on the visjs
Timeline JavaScript library.
devtools::install_github("daattali/timevis")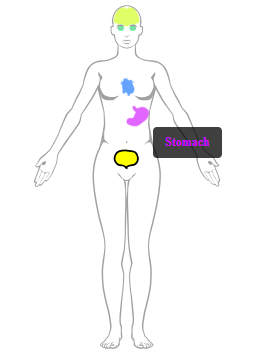
shinybody
Author: Robert Norberg
shinybody is an htmlwidget of the human
body that allows you to hide/show and assign colors to 79 different body
parts.
install.packages("shinybody")