Using at the R Console
You can use dygraph at the R console just like any other plotting function. For example, here’s the code used to plot the nhtemp time series with R graphics along with the code to plot it using dygraphs:
plot(nhtemp, main = "New Haven Temperatures", ylab = "Temp (F)")
dygraph(nhtemp, main = "New Haven Temperatures", ylab = "Temp (F)")
In the default R console the dygraph will appear in an external browser window.
RStudio Viewer
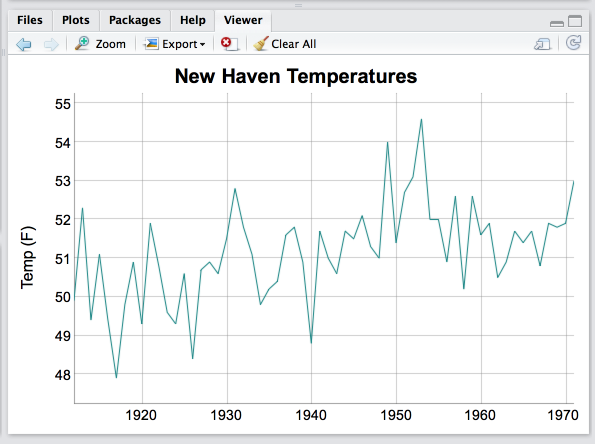
If you call dygraph within RStudio then it’s output appears within the Viewer pane, a special pane dedicated to displaying web content. The Viewer pane works exactly like the Plots pane, and includes history, zoom, and options for exporting it’s contents to image files, the clipboard, or standalone HTML. Here’s what the output of the previous call looks like in the Viewer pane:
RStudio Viewer Pane
Note that plotting to the RStudio Viewer relies on a very recent version of RStudio (v0.98.1056 or higher) so you should download the latest release of RStudio before trying this out.
