Getting started with Shiny Dashboard
Installation
shinydashboard requires Shiny 0.11 or above. To install, run:
install.packages("shinydashboard")Basics
A dashboard has three parts: a header, a sidebar, and a body. Here’s the most minimal possible UI for a dashboard page.
## ui.R ##
library(shinydashboard)

dashboardPage(
  dashboardHeader(),
  dashboardSidebar(),
  dashboardBody()
)
You can quickly view it at the R console by using the shinyApp() function. (You can also use this code as a single-file app).
## app.R ##
library(shiny)
library(shinydashboard)

ui <- dashboardPage(
  dashboardHeader(),
  dashboardSidebar(),
  dashboardBody()
)

server <- function(input, output) { }

shinyApp(ui, server)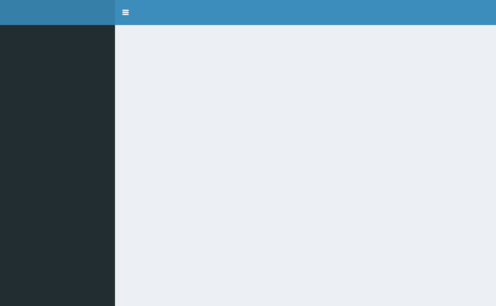
Blank dashboard
Obviously, this dashboard isn’t very useful. We’ll need to add components that actually do something. In the body we can add boxes that have content.
## app.R ##
library(shinydashboard)

ui <- dashboardPage(
  dashboardHeader(title = "Basic dashboard"),
  dashboardSidebar(),
  dashboardBody(
    # Boxes need to be put in a row (or column)
    fluidRow(
      box(plotOutput("plot1", height = 250)),

      box(
        title = "Controls",
        sliderInput("slider", "Number of observations:", 1, 100, 50)
      )
    )
  )
)

server <- function(input, output) {
  set.seed(122)
  histdata <- rnorm(500)

  output$plot1 <- renderPlot({
    data <- histdata[seq_len(input$slider)]
    hist(data)
  })
}

shinyApp(ui, server)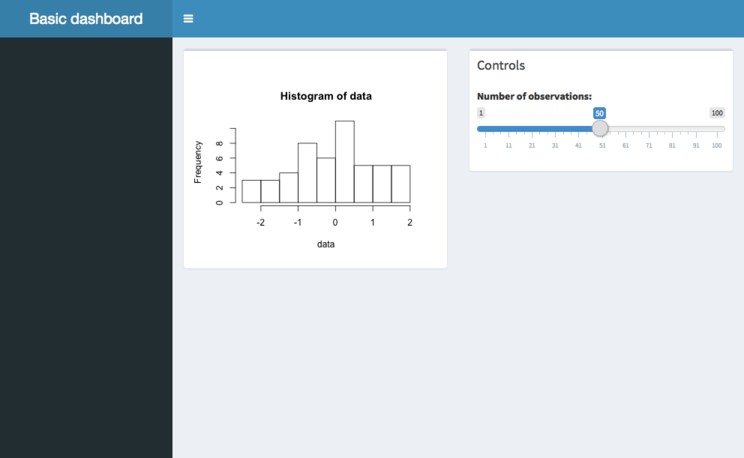
Basic dashboard
Next, we can add content to the sidebar. For this example we’ll add menu items that behave like tabs. These function similarly to Shiny’s tabPanels: when you click on one menu item, it shows a different set of content in the main body.
There are two parts that need to be done. First, you need to add menuItems to the sidebar, with appropriate tabNames.
## Sidebar content
  dashboardSidebar(
    sidebarMenu(
      menuItem("Dashboard", tabName = "dashboard", icon = icon("dashboard")),
      menuItem("Widgets", tabName = "widgets", icon = icon("th"))
    )
  )
In the body, add tabItems with corrsponding values for tabName:
## Body content
  dashboardBody(
    tabItems(
      # First tab content
      tabItem(tabName = "dashboard",
        fluidRow(
          box(plotOutput("plot1", height = 250)),

          box(
            title = "Controls",
            sliderInput("slider", "Number of observations:", 1, 100, 50)
          )
        )
      ),

      # Second tab content
      tabItem(tabName = "widgets",
        h2("Widgets tab content")
      )
    )
  )
The default display, also shown when the “Dashboard” menu item is clicked:

Basic dashboard with tabs 1
And the display when “Widgets” is clicked:
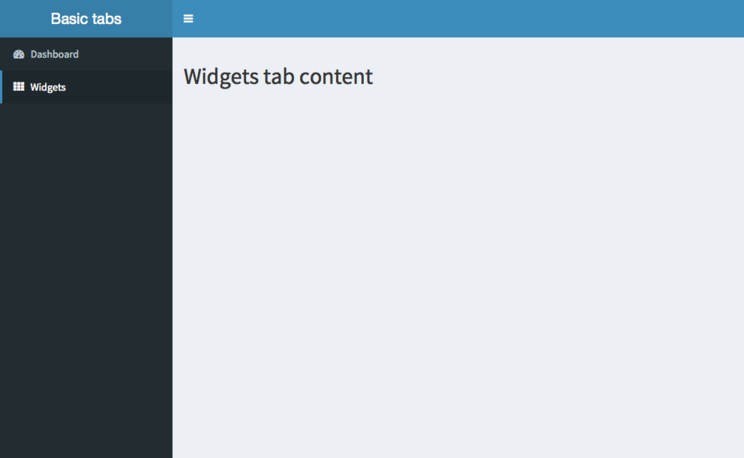
Basic dashboard with tabs 2
That covers the very basics of using shinydashboard.
Next: learn about the structure of a dashboard.