Shiny Dashboard Examples
Examples in this site
Source code for all the example screenshots used in this site.
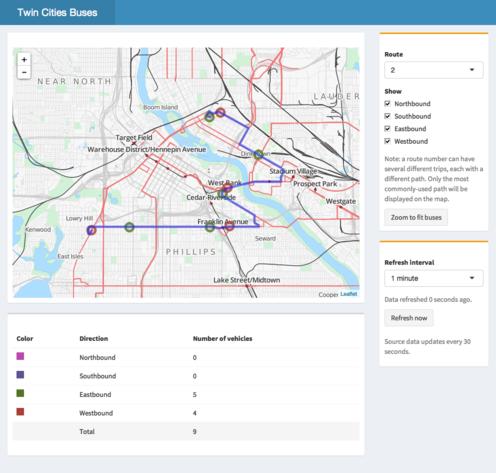
Twin Cities Buses
This app displays live locations of buses in the Minneapolis–Saint Paul Metro Transit system. It fetches data from a live feed, and uses the leaflet package to generate the map.
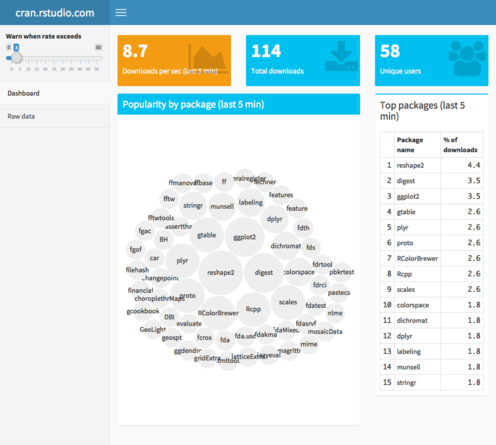
Streaming CRAN data
This is a dashboard that displays streaming data from the RStudio CRAN mirror logs. The streaming data is a 1-week-delayed live stream of download logs from cran.rstudio.com.

