Using DT in Shiny
You can render a table widget in shiny, and obtain some information about its current state, such as the indices of the rows on the current page.
1 A Minimal Example
Here is a minimal example of (client-side) DataTables in Shiny using the convenience functions DTOutput() and renderDT():
library(shiny)
library(DT)
shinyApp(
  ui = fluidPage(DTOutput('tbl')),
  server = function(input, output) {
    output$tbl = renderDT(
      iris, options = list(lengthChange = FALSE)
    )
  }
)
Note that in DT, DTOutput() is an alias of dataTableOutput(), and renderDT() is an alias of renderDataTable(). You are recommended to use DTOutput() and renderDT() to avoid possible collisions with functions of the same names in shiny (shiny::dataTableOutput() and shiny::renderDataTable()).
If you have used the renderDataTable() function in shiny before, please note you should use JS() instead of I() to write literal JavaScript code in options.
library(shiny)
renderDataTable(iris, options = list(
  pageLength = 5,
  initComplete = I('function(setting, json) { alert("done"); }')
))library(DT)
renderDT(
iris, options = list(
pageLength = 5,
initComplete = JS('function(setting, json) { alert("done"); }')
)
)The renderDataTable() function in shiny uses server-side processing and it has no client-side support. DT supports both ways; the default is server-side processing, but you can switch to client-side by calling DT::renderDT() with a server = FALSE argument. When the data object is relatively large, do not use server = FALSE, otherwise it will be too slow to render the table in the web browser, and the table will not be very responsive, either.
The first argument of DT::renderDT() can be either a data object or a table widget returned by datatable(). The latter form can be useful when you want to manipulate the widget before rendering it in Shiny, e.g. you may apply a formatting function to a table widget:
DT::renderDT({
  datatable(iris) %>% formatStyle(
    'Sepal.Width',
    backgroundColor = styleInterval(3.4, c('gray', 'yellow'))
  )
})
2 Interaction with Shiny
There are some information exposed to Shiny from the table widget as you interact with the table in Shiny. In the following sections, we use tableId to denote the output id of the table (i.e. the outputId in DTOutput()). You need to replace tableId with the actual id of the table in your own app.
2.1 Selecting Rows/Columns/Cells
You may select rows, columns, or cells in the table, and obtain the indices of the selected objects. See this Shiny app for a comprehensive example (you can find its source code under system.file('examples', 'DT-selection', package = 'DT')).
2.1.1 Row Selection
The feature of row selection is enabled automatically when a table is embedded in a Shiny app. You can click on a row to toggle its selection status, and the indices of the selected rows are available through input$tableId_rows_selected. See a live example here. You can disable row selection by datatable(..., selection = 'none'), or use the single selection mode by selection = 'single'. The default selection mode is multiple selections (try the table below).
# you can find the example locally in the DT package
app = system.file('examples', 'DT-rows', package = 'DT')
shiny::runApp(app)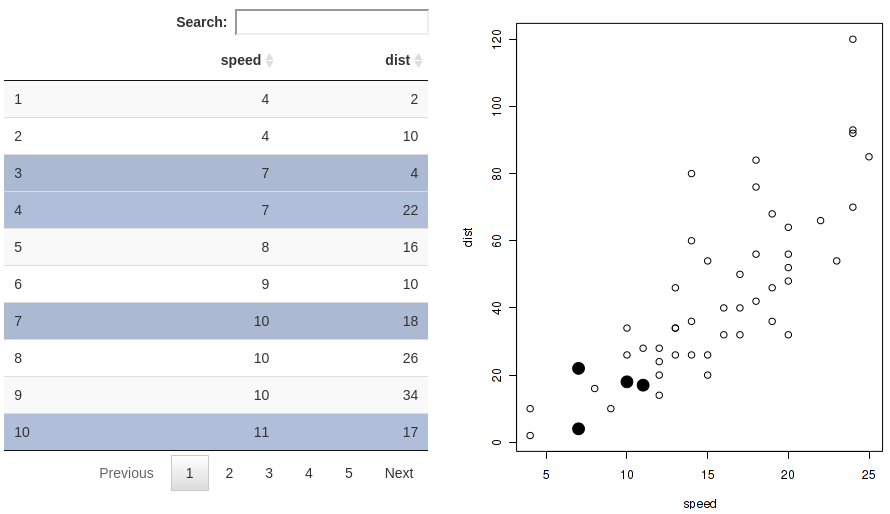
You can also obtain the index of the last clicked row via input$tableId_row_last_clicked (it may be NULL initially and when the table is redrawn).
2.1.2 Column Selection
Row selection is the default mode in DT. You can turn on column selection using datatable(..., selection = list(target = 'column')). In this case, you can click on any cell to select a column, and the (numeric) indices of the selected columns will be available in input$tableId_columns_selected.
You may also select rows and columns simultaneously using target = 'row+column'. In this case, column selection is achieved by clicking on the table footer. Clicking on the table body will select/deselect rows.
2.1.3 Cell Selection
Cell selection is enabled by target = 'cell' in the selection argument. The indices of selected cells are available through input$tableId_cells_selected as a matrix of two columns: each row of the matrix contains the row index and column index of a selected cell. When no cells are selected, the matrix has zero rows.
2.1.4 Pre-selection
The selection argument of datatable() can also include a component selected to specify which rows/columns/cells to be pre-selected when the table is initialized. When target = 'row' or 'column', selected is a vector of row or column indices. For the case of target = 'row+column', selected should be a list of two components rows and cols, e.g. list(rows = c(1, 2, 4, 9), cols = c(1, 3)). For target = 'cell', it should be a matrix of two columns: the first column is the row indices of selected cells, and the second column is the column indices.
2.2 DataTables Information
As you interact with the table (e.g. sort columns, search the table, or navigate through pages), DT will expose some information about the current state of the table to Shiny. At the moment, these information are available in the input object of the Shiny server function (suppose the table output id is tableId):
input$tableId_cell_clicked: information about the cell being clicked of the formlist(row = row_index, col = column_index, value = cell_value)(example)input$tableId_rows_current: the indices of rows on the current pageinput$tableId_rows_all: the indices of rows on all pages (after the table is filtered by the search strings)input$tableId_search: the global search stringinput$tableId_search_columns: the vector of column search strings when column filters are enabledinput$tableId_state: the state information of the table (a list containing the search string, ordering and paging information; it is available only if the optionstateSave = TRUEis applied to the table)
This example shows how you can make use of these information to highlight points on a scatterplot and download the filtered data.
app = system.file('examples', 'DT-info', package = 'DT')
shiny::runApp(app)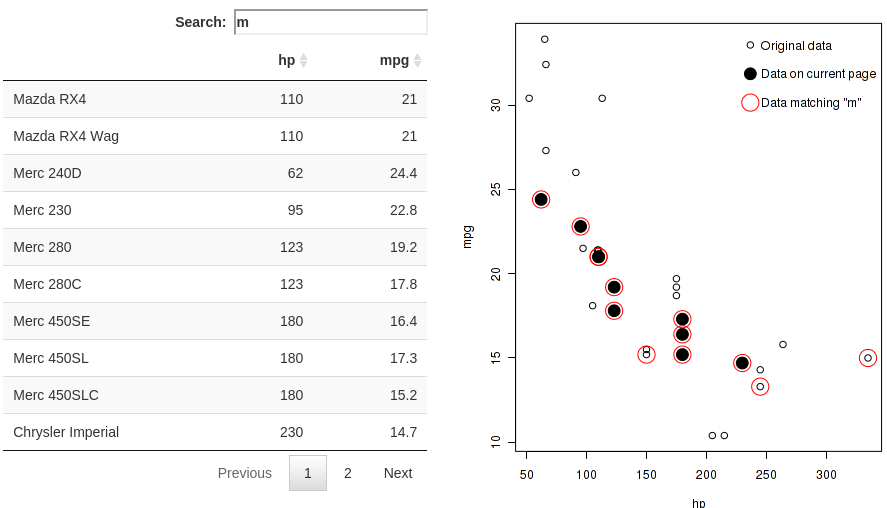
2.3 Manipulate An Existing DataTables Instance
After a table has been rendered in a Shiny app, you can use the proxy object returned from dataTableProxy() to manipulate it. Currently supported methods are selectRows(), selectColumns(), selectCells(), selectPage(), and addRow(). See this Shiny app for an example of using these methods to update a table.
Sometimes the data behind the table may change, and you do not want to regenerate the whole table, but only want to replace the data values. The state of the table (sorting, filtering, and pagination) can be preserved after you replace the data with replaceData(). Here is a short example:
app = system.file('examples', 'DT-reload', package = 'DT')
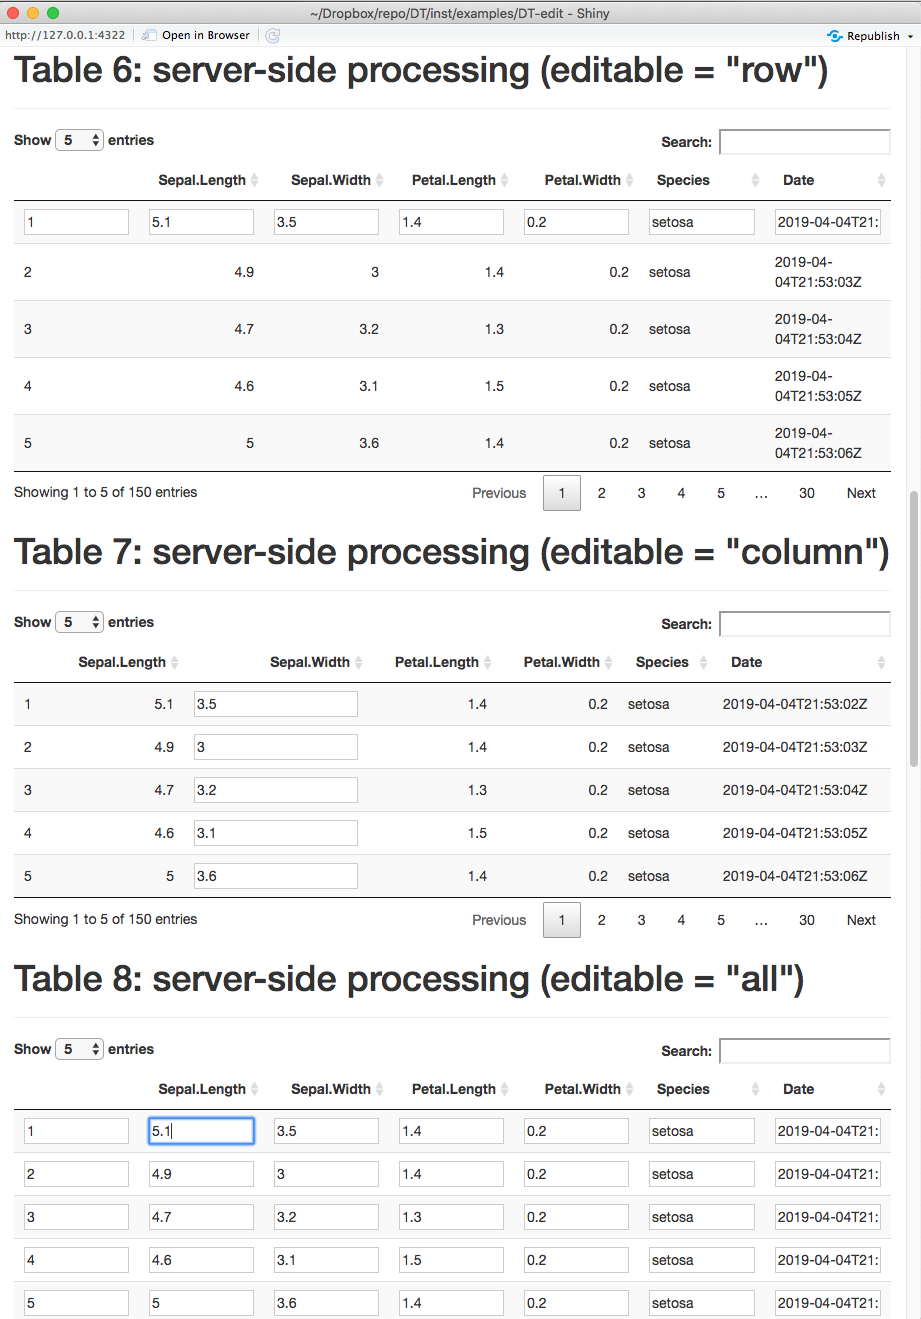
shiny::runApp(app)2.4 Edit Tables
You can edit a table via the editable argument of datatable(). After you finish editing, you can obtain the row/column indices and the new values of the cells that were edited via input$tableId_cell_info. See this Shiny app for more concrete examples.
3 More Examples
Below is a list of miscellaneous examples: