Shiny is a web framework for R and Python. To learn more about Shiny, visit the shiny website.
The Leaflet package includes powerful and convenient features for integrating with Shiny applications.
Most Shiny output widgets are incorporated into an app by including
an output (e.g., plotOutput()) for the widget in the UI
definition, and using a render function (e.g.,
renderPlot()) in the server function. Leaflet maps are no
different; in the UI you call leafletOutput(), and on the
server side you assign a renderLeaflet() call to the
output. Inside the renderLeaflet() expression, you return a
Leaflet map object.
library(shiny)
library(leaflet)

r_colors <- rgb(t(col2rgb(colors()) / 255))
names(r_colors) <- colors()

ui <- fluidPage(
  leafletOutput("mymap"),
  p(),
  actionButton("recalc", "New points")
)

server <- function(input, output, session) {

  points <- eventReactive(input$recalc, {
    cbind(rnorm(40) * 2 + 13, rnorm(40) + 48)
  }, ignoreNULL = FALSE)

  output$mymap <- renderLeaflet({
    leaflet() %>%
      addProviderTiles(providers$CartoDB.Positron,
        options = providerTileOptions(noWrap = TRUE)
      ) %>%
      addMarkers(data = points())
  })
}

shinyApp(ui, server)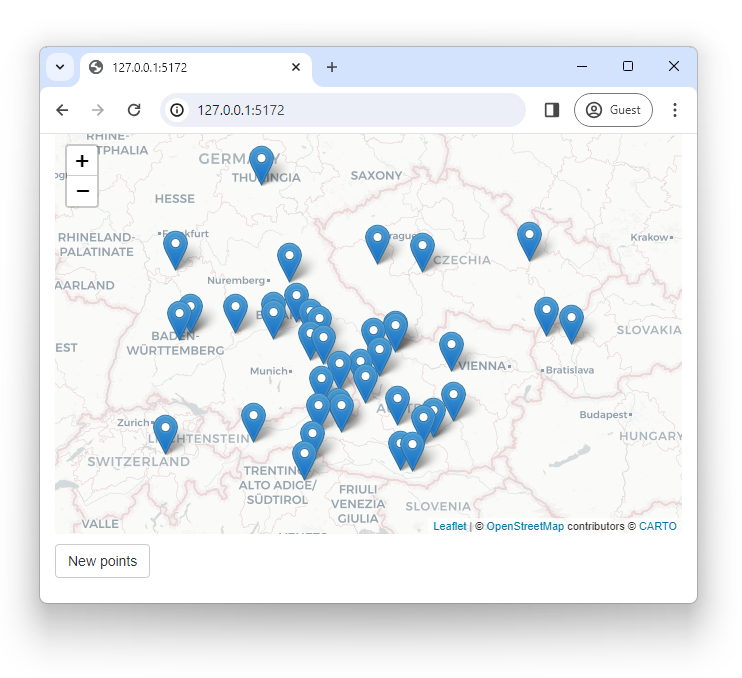
Modifying Existing Maps with leafletProxy
This works, but reactive inputs and expressions that affect the
renderLeaflet() expression will cause the entire map to be
redrawn from scratch and reset the map position and zoom level.
For some situations that may be acceptable or desirable behavior. But in other situations, you may want finer-grained control over the map, such as changing the color of a single polygon or adding a marker at the point of a click – without redrawing the entire map.
To modify a map that’s already running in the page, you use the
leafletProxy() function in place of the
leaflet() call, but otherwise use Leaflet function calls as
normal.
Normally you use leaflet to create the static aspects of
the map, and leafletProxy() to manage the dynamic elements,
like so:
library(shiny)
library(leaflet)
library(RColorBrewer)

ui <- bootstrapPage(
  tags$style(type = "text/css", "html, body {width:100%;height:100%}"),
  leafletOutput("map", width = "100%", height = "100%"),
  absolutePanel(top = 10, right = 10,
    sliderInput("range", "Magnitudes", min(quakes$mag), max(quakes$mag),
      value = range(quakes$mag), step = 0.1
    ),
    selectInput("colors", "Color Scheme",
      rownames(subset(brewer.pal.info, category %in% c("seq", "div")))
    ),
    checkboxInput("legend", "Show legend", TRUE)
  )
)

server <- function(input, output, session) {

  # Reactive expression for the data subsetted to what the user selected
  filteredData <- reactive({
    quakes[quakes$mag >= input$range[1] & quakes$mag <= input$range[2],]
  })

  # This reactive expression represents the palette function,
  # which changes as the user makes selections in UI.
  colorpal <- reactive({
    colorNumeric(input$colors, quakes$mag)
  })

  output$map <- renderLeaflet({
    # Use leaflet() here, and only include aspects of the map that
    # won't need to change dynamically (at least, not unless the
    # entire map is being torn down and recreated).
    leaflet(quakes) %>% addTiles() %>%
      fitBounds(~min(long), ~min(lat), ~max(long), ~max(lat))
  })

  # Incremental changes to the map (in this case, replacing the
  # circles when a new color is chosen) should be performed in
  # an observer. Each independent set of things that can change
  # should be managed in its own observer.
  observe({
    pal <- colorpal()

    leafletProxy("map", data = filteredData()) %>%
      clearShapes() %>%
      addCircles(radius = ~10^mag/10, weight = 1, color = "#777777",
        fillColor = ~pal(mag), fillOpacity = 0.7, popup = ~paste(mag)
      )
  })

  # Use a separate observer to recreate the legend as needed.
  observe({
    proxy <- leafletProxy("map", data = quakes)

    # Remove any existing legend, and only if the legend is
    # enabled, create a new one.
    proxy %>% clearControls()
    if (input$legend) {
      pal <- colorpal()
      proxy %>% addLegend(position = "bottomright",
        pal = pal, values = ~mag
      )
    }
  })
}

shinyApp(ui, server)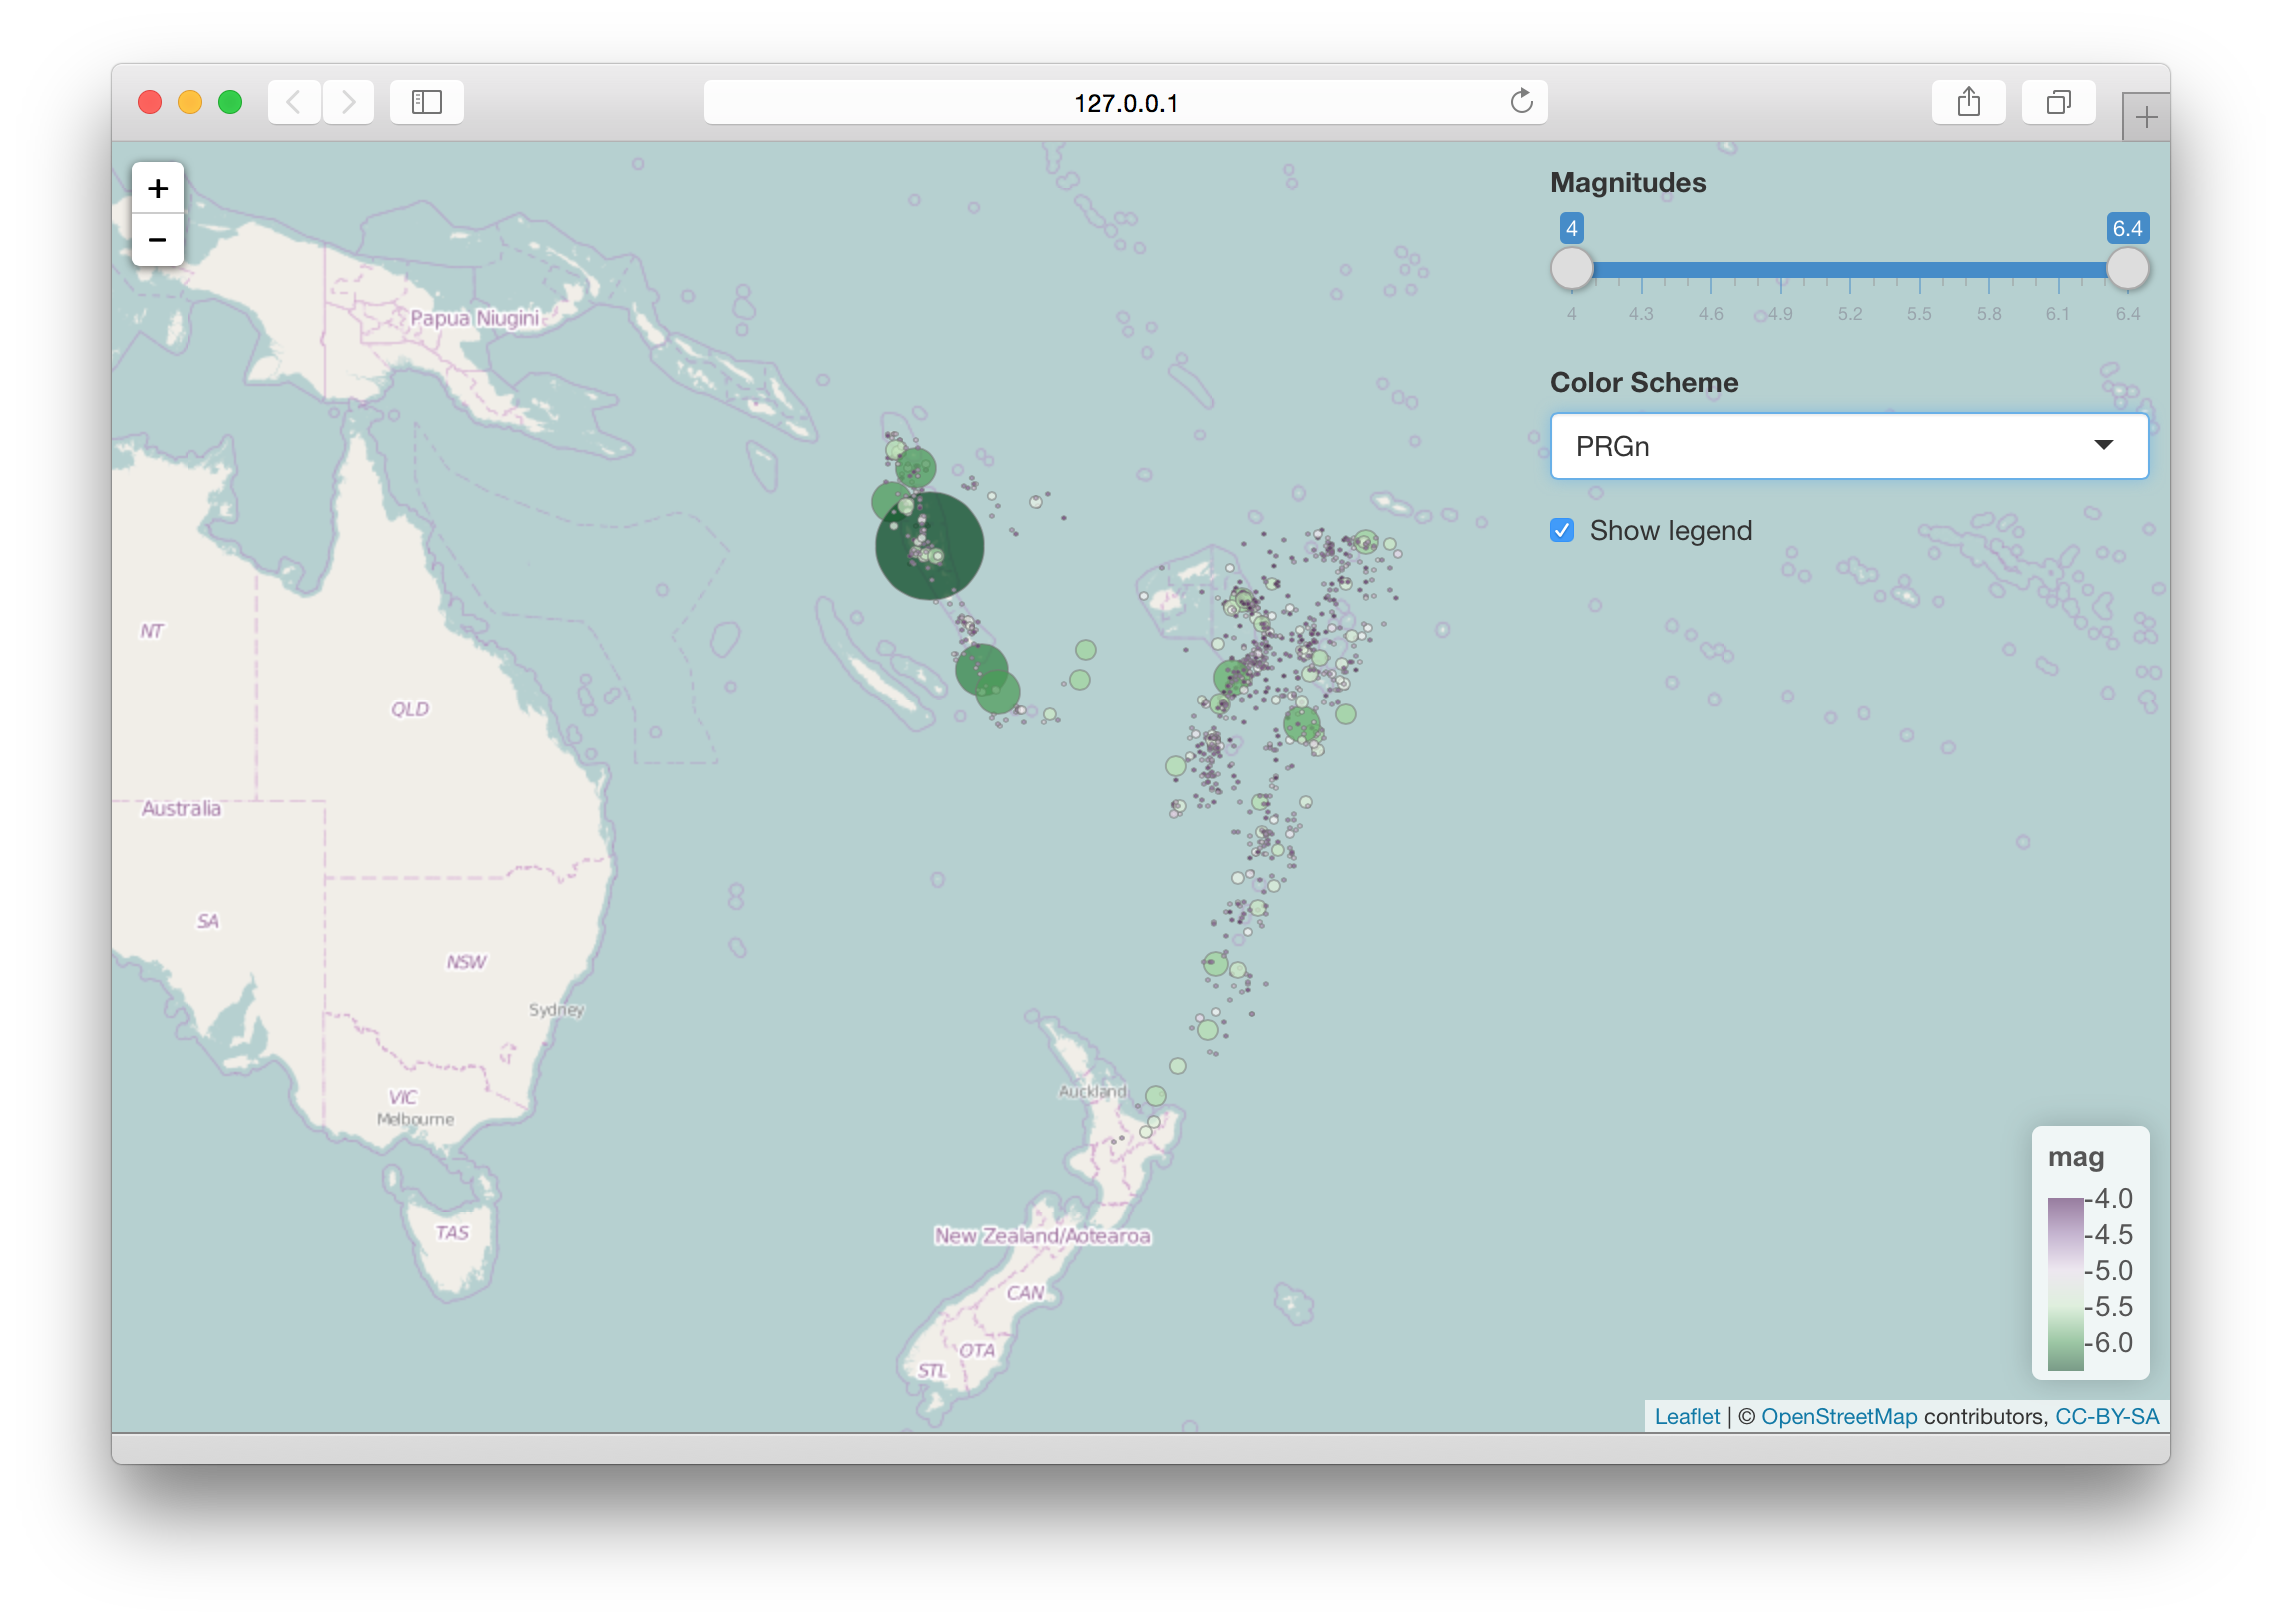
Besides adding layers, you can set the map bounds, remove specific objects by ID, or clear categories of layers.
proxy <- leafletProxy("mymap")

# Fit the view to within these bounds (can also use setView)
proxy %>% fitBounds(0, 0, 11, 11)

# Create circles with layerIds of "A", "B", "C"...
proxy %>% addCircles(1:10, 1:10, layerId = LETTERS[1:10])

# Remove some of the circles
proxy %>% removeShape(c("B", "F"))

# Clear all circles (and other shapes)
proxy %>% clearShapes()
Understanding Layer IDs
Layer IDs can be used to replace or remove specific map elements. (Note: For managing groups of map elements, see the Show/Hide Layers topic.)
When you give an object a layer ID, if a similar object exists with the same ID, it will be removed from the map when the new object is added.
All layer-adding functions take a layerId argument.
Generally this is a vectorized argument; if adding 50 polygons, you’ll
need to pass either NULL or a 50-element character vector
as your layerId value. (If you use a single-element
character vector as your layerId, then all of the 50
polygons will have the same ID, and all but the last polygon will be
removed; so don’t do that!)
Layer IDs are namespaced by category. Layer IDs only need be unique
within their category; a call to addCircles() will not
cause any tile layers to be removed, regardless of layer ID, because
circles and tiles are in different categories.
| Category | Add functions | Remove | Clear |
|---|---|---|---|
| tile |
addTiles(), addProviderTiles()
|
removeTiles() |
clearTiles() |
| marker |
addMarkers(), addCircleMarkers()
|
removeMarker() |
clearMarkers() |
| shape |
addPolygons(), addPolylines(),
addCircles(), addRectangles()
|
removeShape() |
clearShapes() |
| geojson | addGeoJSON() |
removeGeoJSON() |
clearGeoJSON() |
| topojson | addTopoJSON() |
removeTopoJSON() |
clearTopoJSON() |
| control | addControl() |
removeControl() |
clearControls() |
Inputs/Events
Leaflet maps and objects send input values (which we’ll refer to as “events” in this document) to Shiny as the user interacts with them.
Object events
Object event names generally use this pattern:
input$MAPID_OBJCATEGORY_EVENTNAME
So for a leafletOutput("mymap") had a circle on it,
clicking on that circle would update the Shiny input at
input$mymap_shape_click. (Note that the layer ID is not
part of the name, though it is part of the value.)
If no shape has ever been clicked on this map, then
input$mymap_shape_click is null.
Valid values for OBJCATEGORY above are marker,
shape, geojson, and topojson.
(Tiles and controls don’t raise mouse events.) Valid values for
EVENTNAME are click, mouseover, and
mouseout.
All of these events are set to either NULL if the event
has never happened, or a list() that includes:
-
lat- The latitude of the object, if available; otherwise, the mouse cursor -
lng- The longitude of the object, if available; otherwise, the mouse cursor -
id- ThelayerId, if any
GeoJSON events also include additional properties:
-
featureId- The feature ID, if any -
properties- The feature properties
Map events
The map itself also has a few input values/events.
input$MAPID_click is an event that is sent when
the map background or basemap is clicked. The value is a list with
lat and lng.
input$MAPID_bounds provides the
latitude/longitude bounds of the currently visible map area; the value
is a list() that has named elements north,
east, south, and west.
input$MAPID_zoom is an integer that indicates
the zoom
level.
input$MAPID_center provides the
latitude/longitude of the center of the currently visible map area; the
value is a list() that has named elements lat
and lng.
Putting it all together
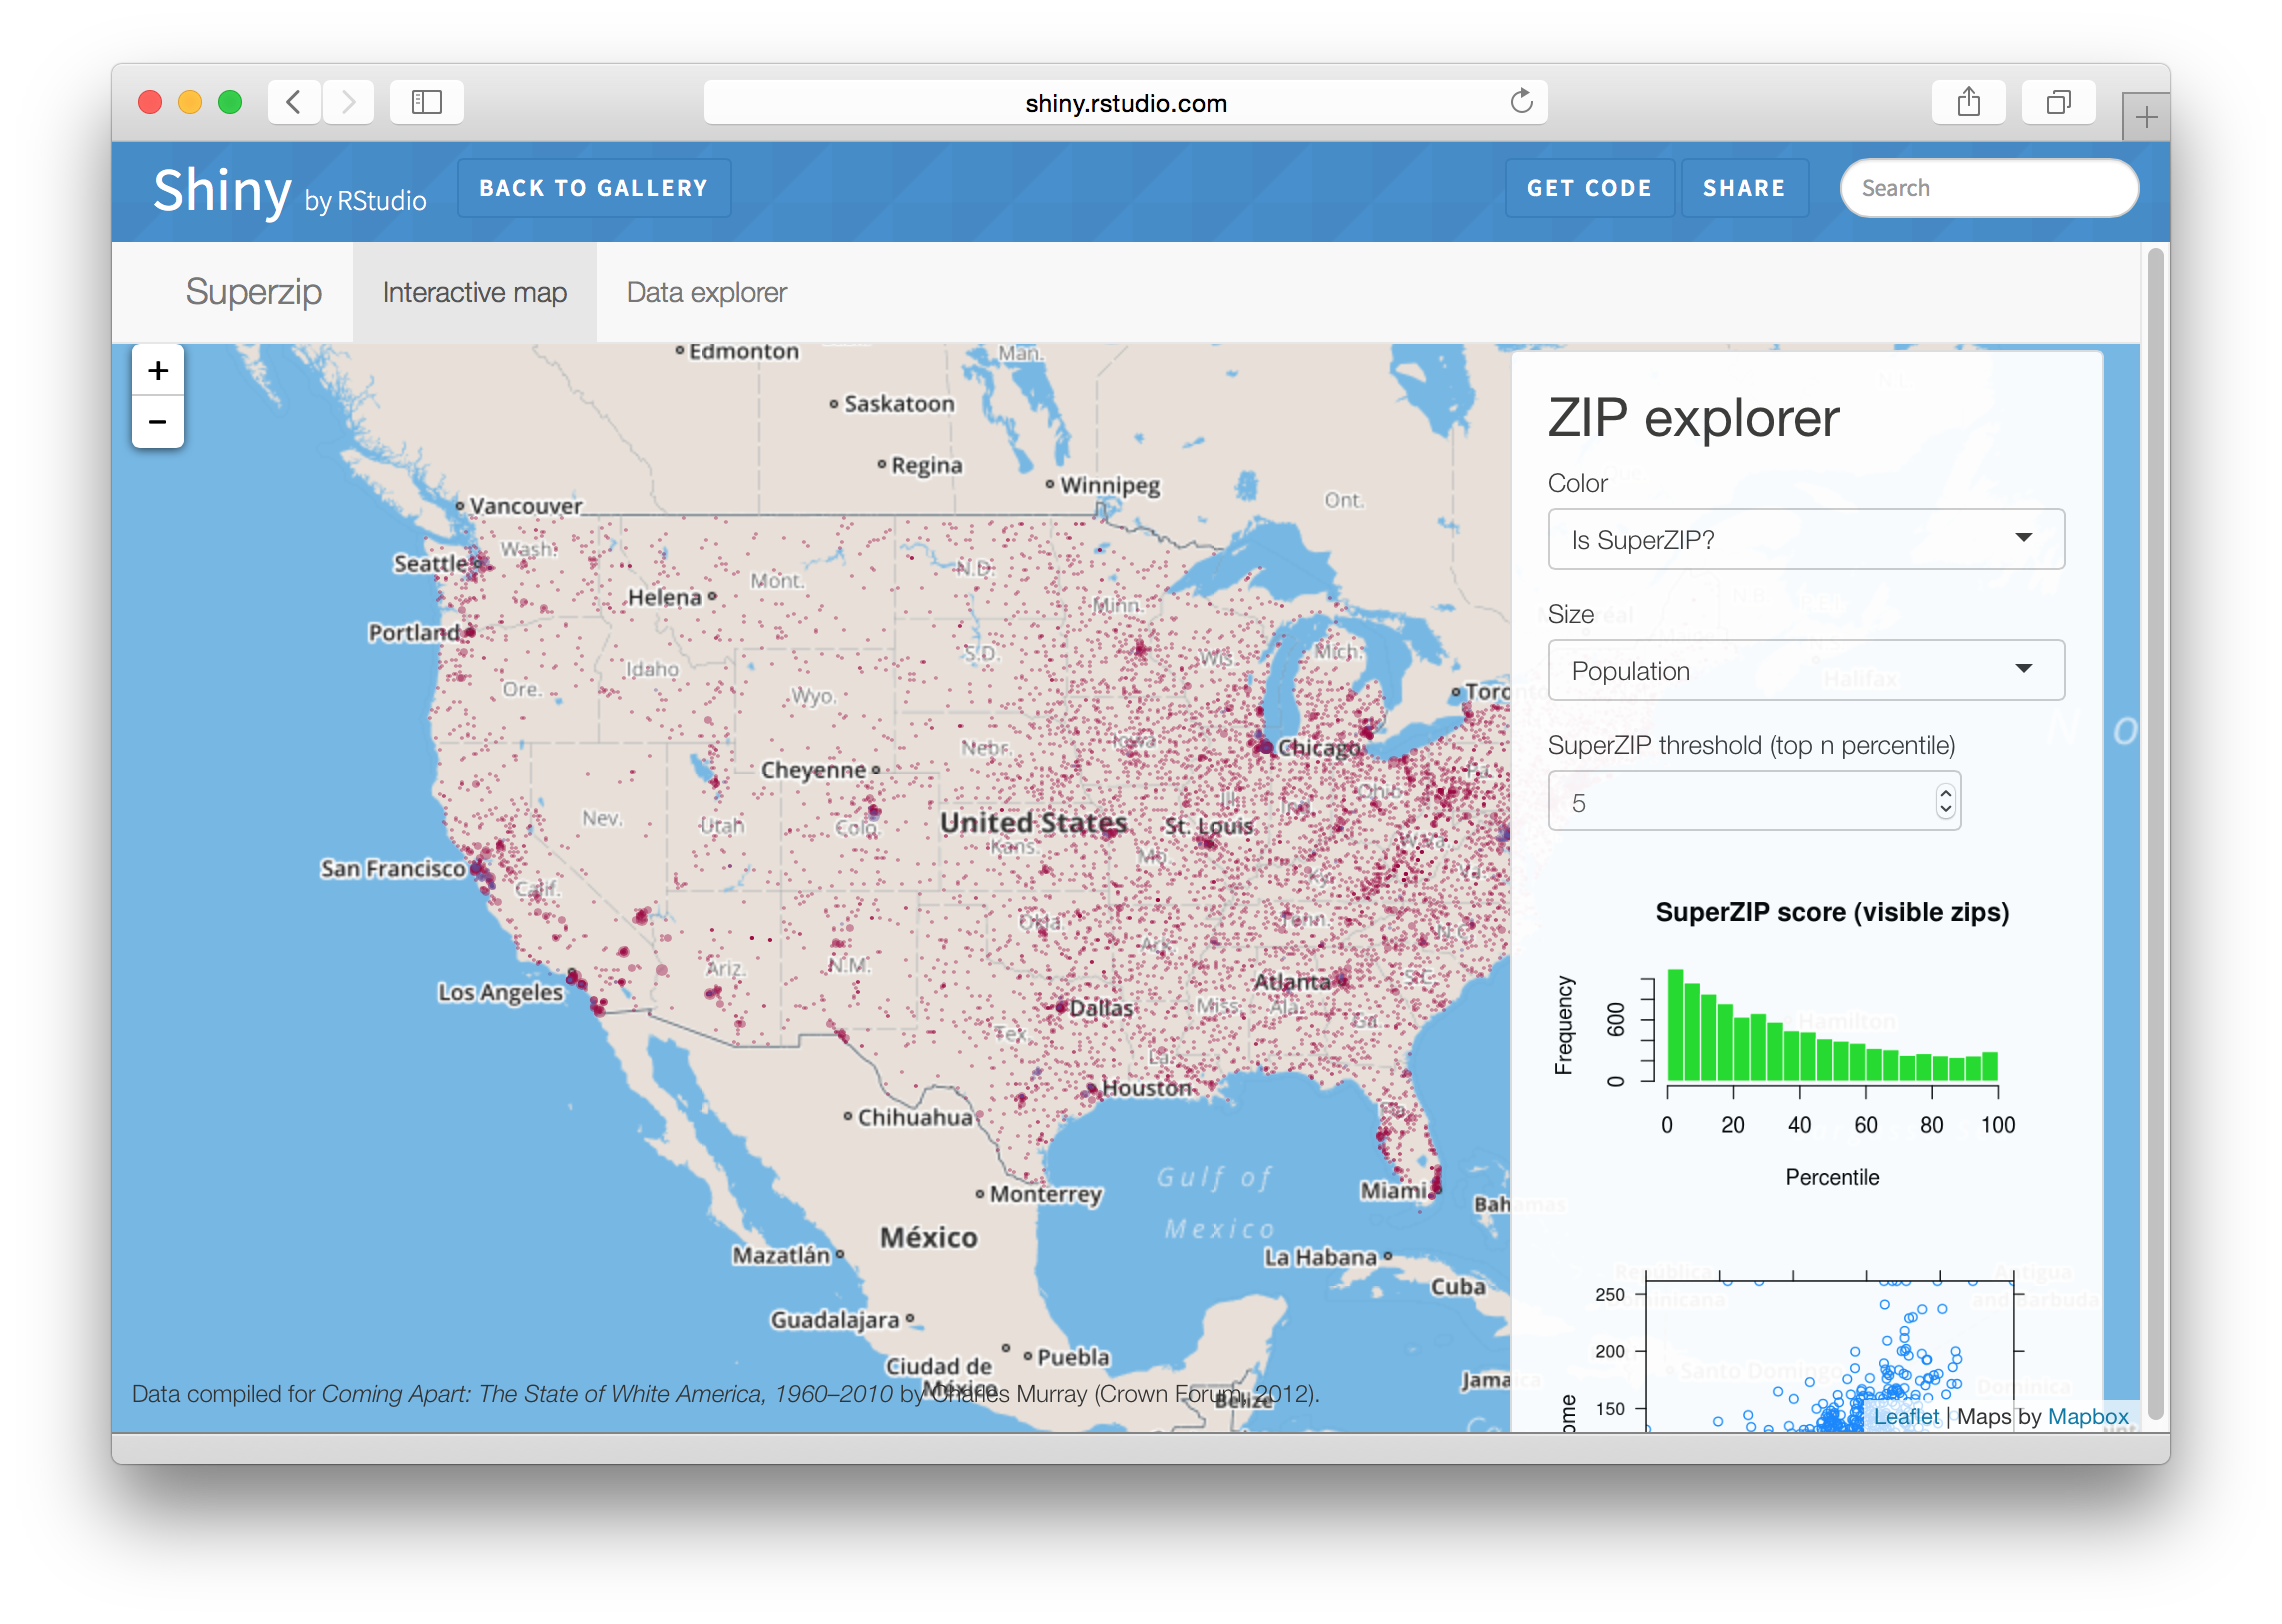
For an extensive example of Shiny and Leaflet working together, take a look at the SuperZip Explorer example app (note the “Get Code” button at the top of the page). (Hint: Try clicking on the bubbles, and also notice that the plots in the sidebar change as you pan and zoom around the map.)