An R package that helps you create Tableau dashboard extensions, using the power of R and Shiny.
Installation
remotes::install_github("rstudio/shinytableau")Note that shinytableau relies on a version of the {shiny} package that’s currently newer than the most recent CRAN release, so installing shinytableau will also install {shiny} from GitHub.
Motivation
Many organizations rely on Tableau to provide day-to-day insights from their data. Thanks to Tableau’s point-and-click interface and focused feature set, almost anyone can produce attractive and useful visualizations and dashboards.
On the other hand, tasks that are routine to R users can sometimes be difficult or impossible to achieve with Tableau alone. So it’s common to use R to preprocess data that is then fed to Tableau, or use Tableau’s R integration features to fortify their data tables with columns calculated by R.
But there hasn’t been an obvious way to let Tableau take advantage of R’s powerful visualization and reporting capabilities. The R platform has a capable plotting system in base, powerful grammar-of-graphics frameworks in ggplot2 and plotly, and hundreds of bespoke visualization libraries for specific types of analysis or domains.
The goal of shinytableau is to let R users create reusable Tableau dashboard extensions, using the power of R and Shiny to generate visualizations that are not achievable with Tableau alone.
What can you do with shinytableau?
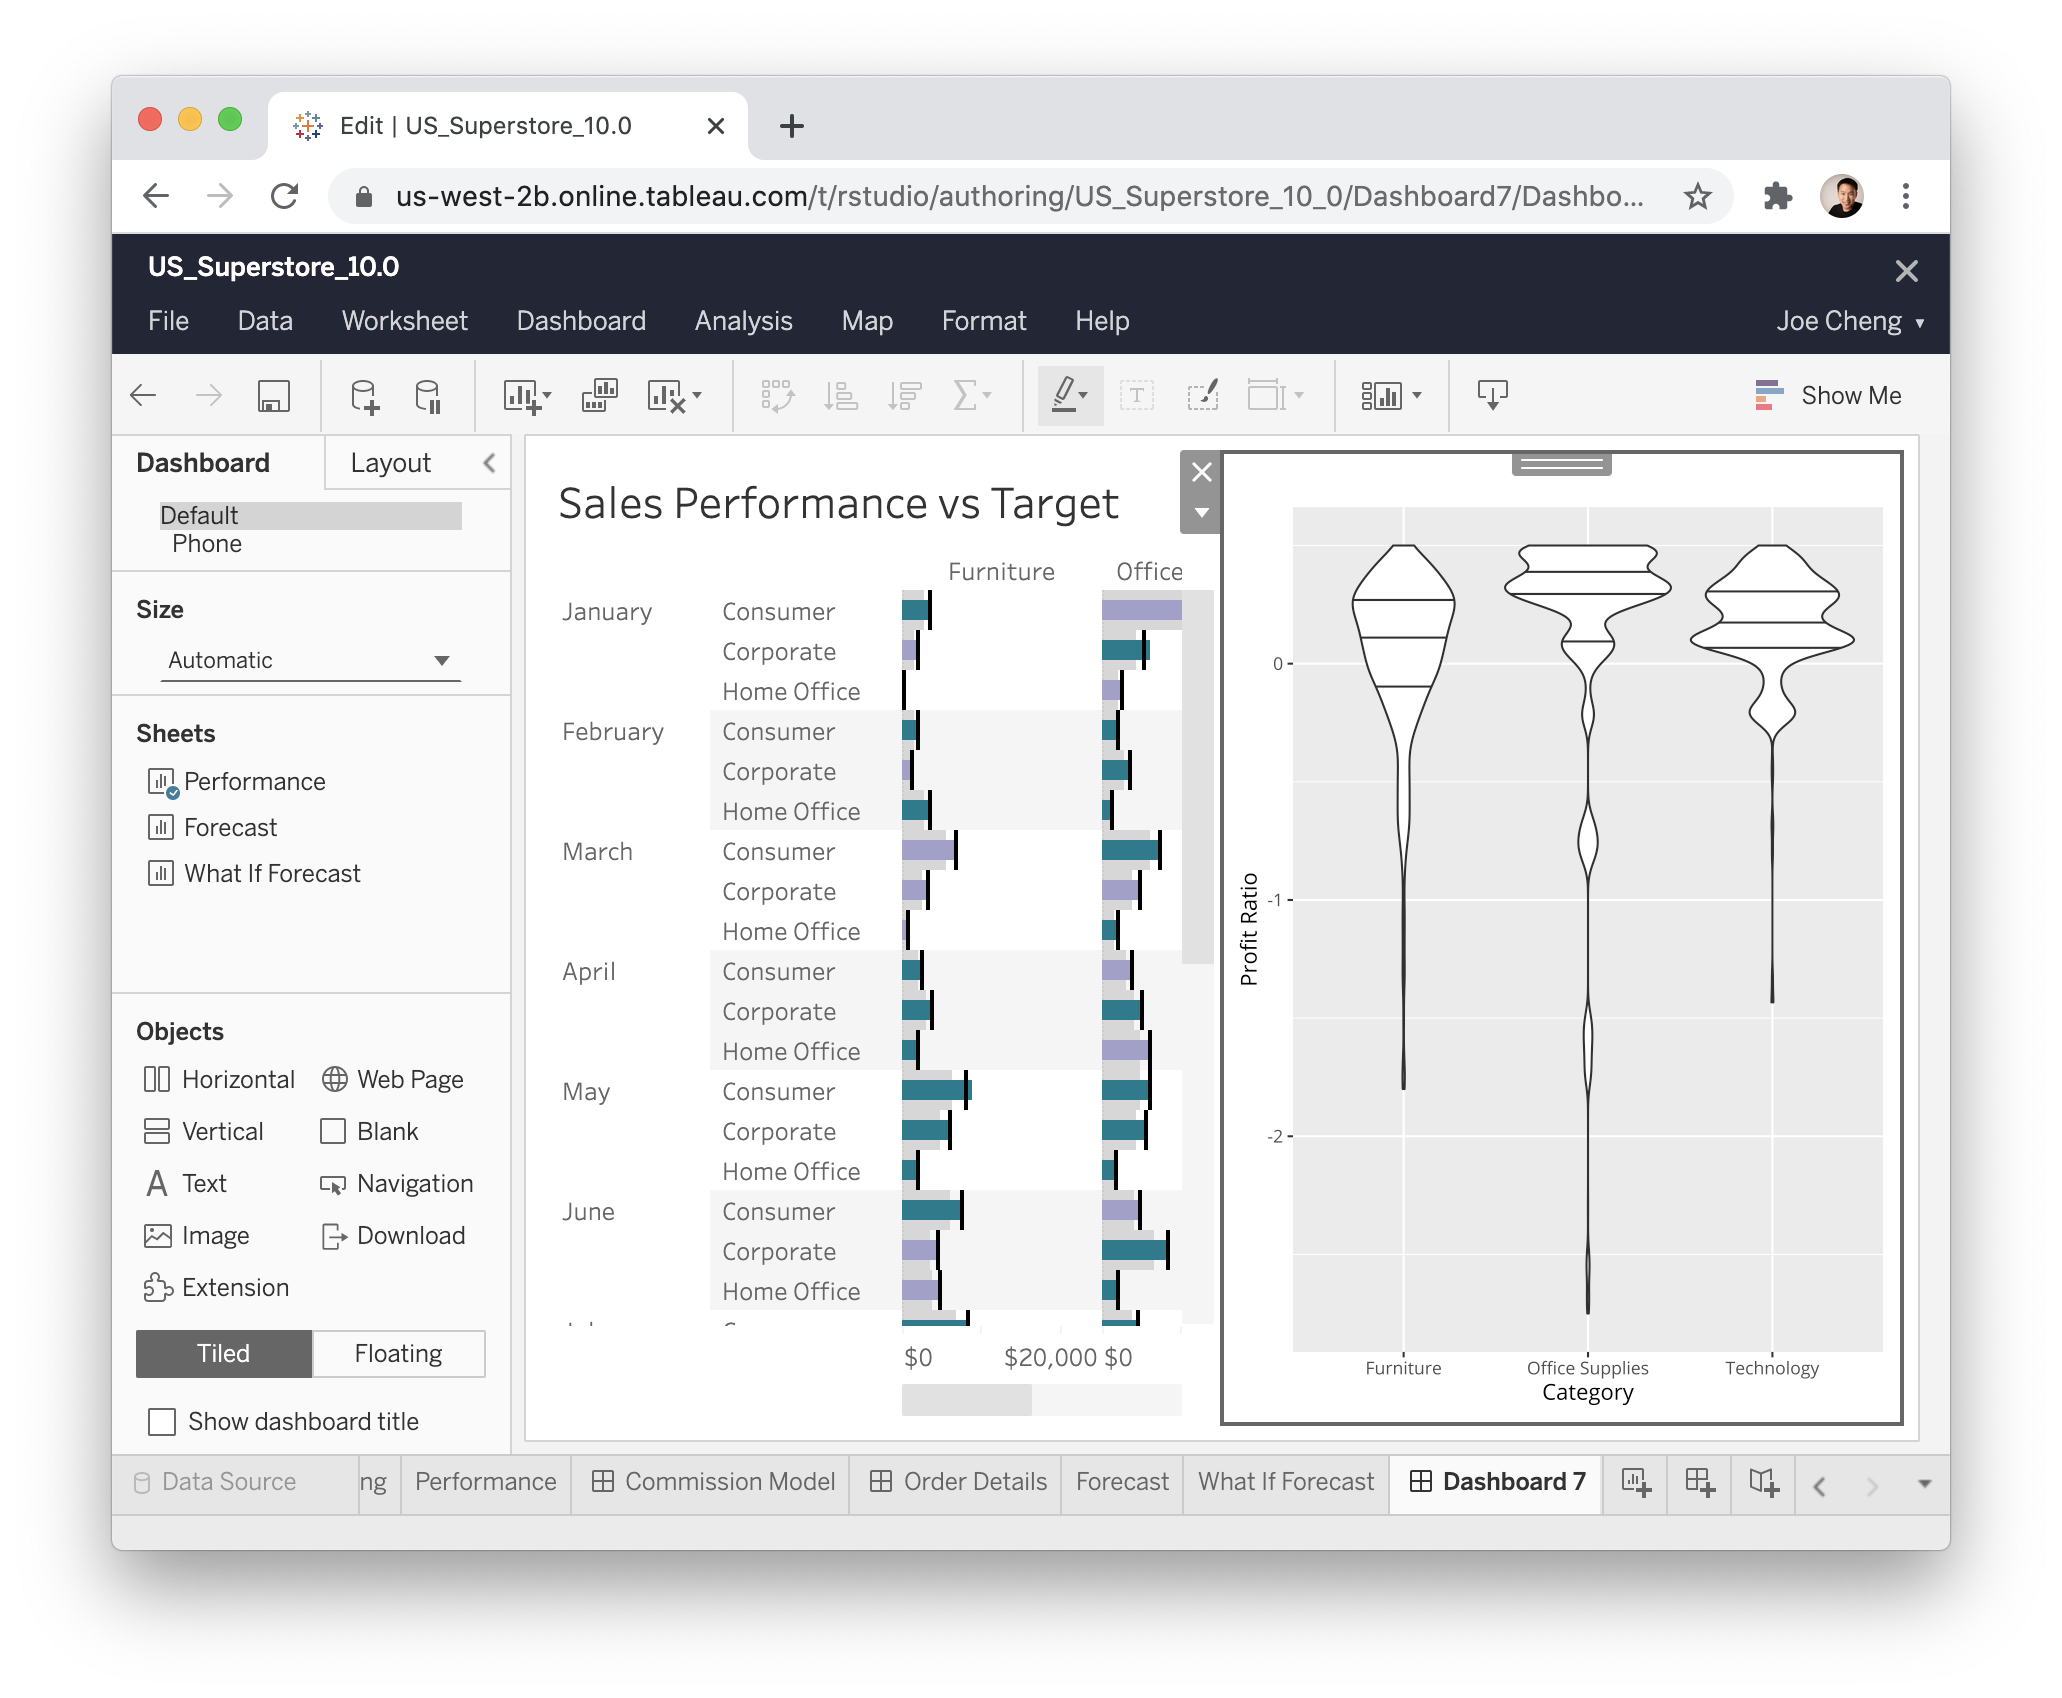
shinytableau makes it possible for a Tableau user to open up a rectangle in their dashboard, which we can then fill with a Shiny app. This Shiny app can do anything a normal Shiny app can do:
Present input controls like sliders, drop-downs, and text boxes.
Display reactive outputs like tables, plots, and HTML widgets.
Perform arbitrary actions based on events (e.g. button clicks).
Plus, you gain a few additional Tableau-specific capabilities, including:
Enumerate any worksheets that are embedded in the same dashboard.
Access data from such worksheets as an R data frame.
Provide a configuration dialog (also written in Shiny) to give Tableau users a friendly UI for specifying settings for your extension, such as which worksheet to pull data from, what columns to use in your visualization, etc.
How can I get started?
First, this package isn’t for everyone! If you’re a Tableau user with no experience writing code for R and/or Shiny, this is not a great place to start. Instead, we’d suggest checking out R for Data Science and then Mastering Shiny.
If you do know R and have written Shiny apps before, welcome! The overview tutorial is the place to start. You’ll need a copy of Tableau Desktop, or access to Tableau Server or Tableau Online and an admin friendly enough to whitelist your extensions.
Note that this package is new and fairly experimental. At the time of this writing, we are mostly interested in feedback from R/Tableau users. If you’re running into problems, or aren’t sure if your use case is supported, please file an issue!
FAQ
I thought Tableau already supports R?
As of this writing, Tableau’s support for R is limited to calculated fields and Tableau Prep scripts. Neither of those entry points are useful for embedding R-based visualizations and user interfaces within Tableau dashboards, which is shinytableau’s goal.
Why wouldn’t I just build the whole dashboard in Shiny?
You definitely could, and almost all of our community members do. However, there are many organizations where Tableau is deeply entrenched, both technically and culturally, and embedding a little bit of Shiny into a lot of Tableau might be an easier sell than replacing a Tableau dashboard that’s otherwise doing a fine job.
And while it’s certainly more work to design and build shinytableau extensions than Shiny dashboards, the fact that they can be reused by non-coders could be a significant benefit.