Layout Examples
layout-examples.RmdIntroduction
The gridlayout package lets you quickly define a grid-based layout that can drastically alter the appearance of an app without changing the ui markup at all. The following are all screenshots from the same app with different layout definitions.
This list is inspired by the flexdashboard layouts vignette.
Note: The layouts defined are given as the markdown table syntax
here, although typically you’ll want to use the character-vector syntax.
See vignette('defining-a-layout') for more info on the
pros-and-cons of the different layout definition methods.
App UI code:
The following code is the UI definition used for all the screenshots. The only thing that changes is the layout definition.
ui <- grid_page(
  layout = my_layout,
  grid_card_text("header", "My gridlayout app"),
  grid_card(
    "chickens",
    tabsetPanel(
      tabPanel("Plot", plotOutput("chickPlot", height = "100%")),
      tabPanel("Fastest growing", gt_output("chickTable"))
    )
  ),
  grid_card(
    "treePlot",
    plotOutput("treePlot", height = "100%")
  ),
  grid_card(
    "yarnPlot",
    plotOutput("yarnPlot", height = "100%")
  ),
  grid_card(
    "stockTable",
    gt_output("stockTable"), scrollable = TRUE
  ),
  # Allows us to use layouts without some elements declared
  flag_mismatches = FALSE
)
The only slightly wonky thing here is the setting of
flag_mismatches to FALSE. This just disables
the checks that makes sure elements declared in layout match those in
the ui definition. Here we sometimes don’t include the
stockTable element in our layout.
While it’s not important, for the demo’s here, the whole app code is provided at the end of this document if you want to copy each layout and try yourself.
Basic stack
my_layout <- new_gridlayout("
  |1rem  |1fr      |
  |80px  |header   |
  |1fr   |chickens |
  |1fr   |treePlot |
|1fr |stockTable |") 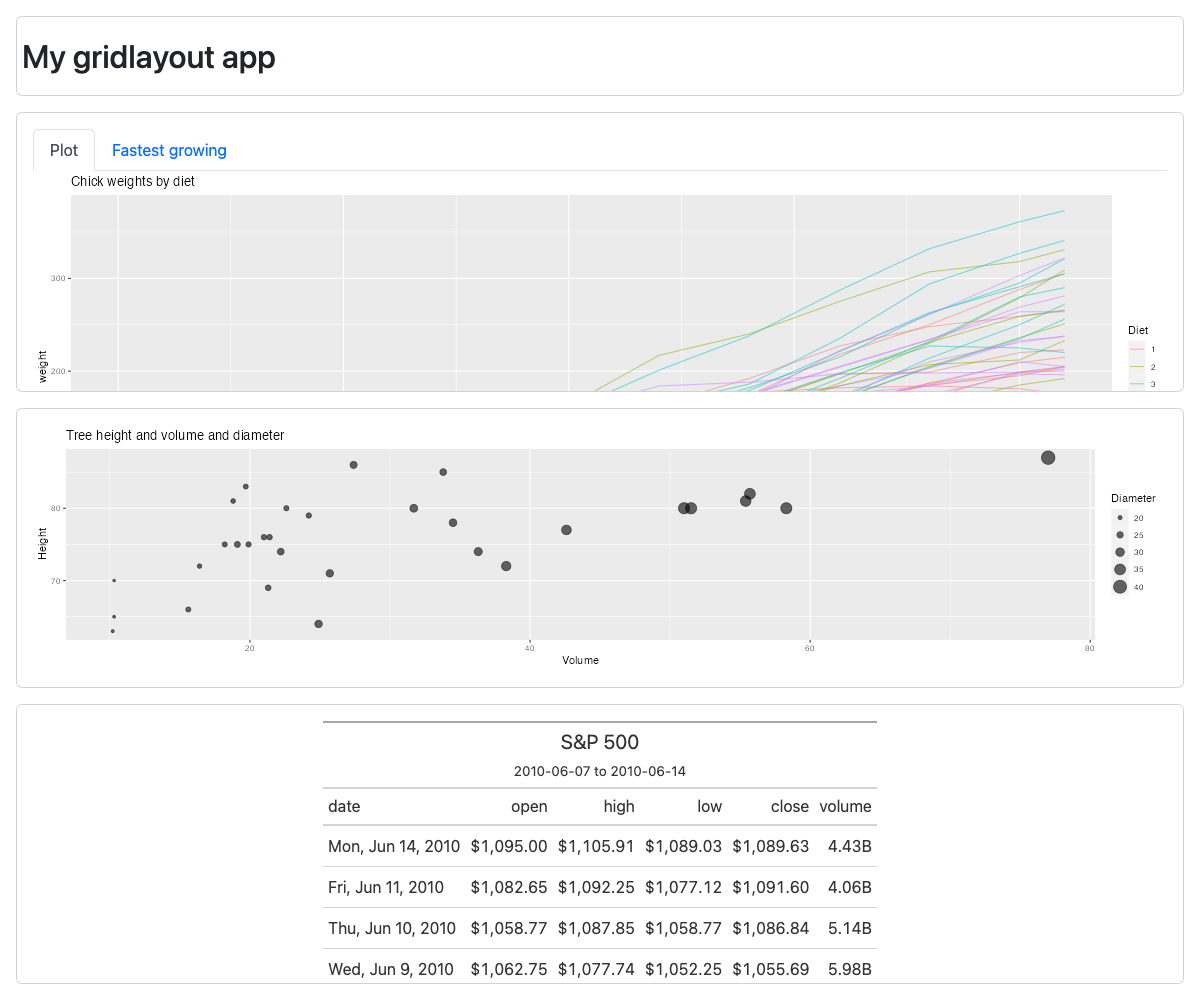
Scrolling stack
Note the use of all definite sizes (e.g. no fr or
auto units) for row heights.
my_layout <- new_gridlayout("
  |1rem  |1fr        |
  |80px  |header     |
  |400px |chickens   |
  |400px |treePlot   |
|400px |stockTable |") 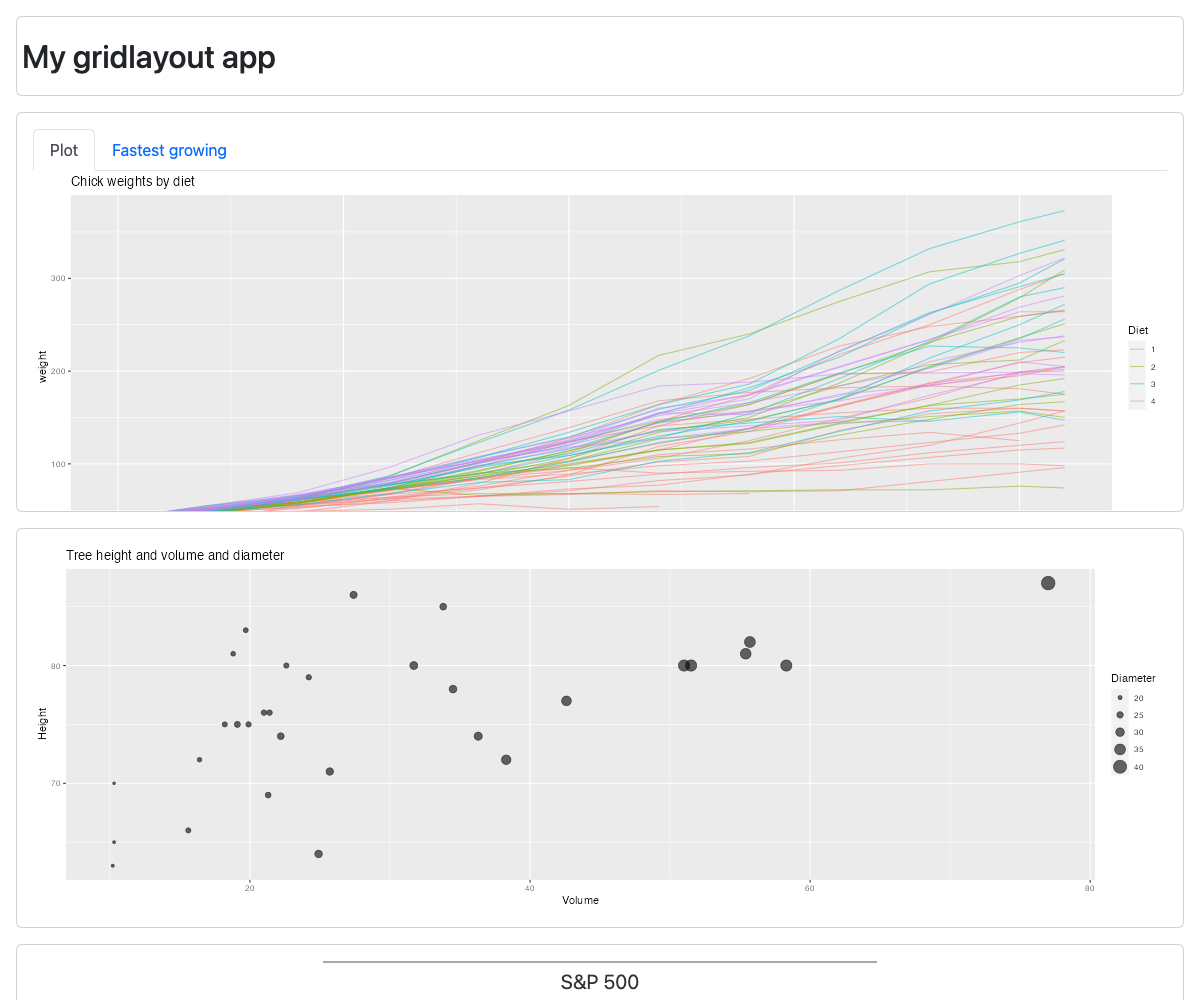
2x2 equal grid
my_layout <- new_gridlayout("
  |1rem |1fr        |1fr      |
  |1fr  |header     |chickens |
|1fr |stockTable |treePlot |") 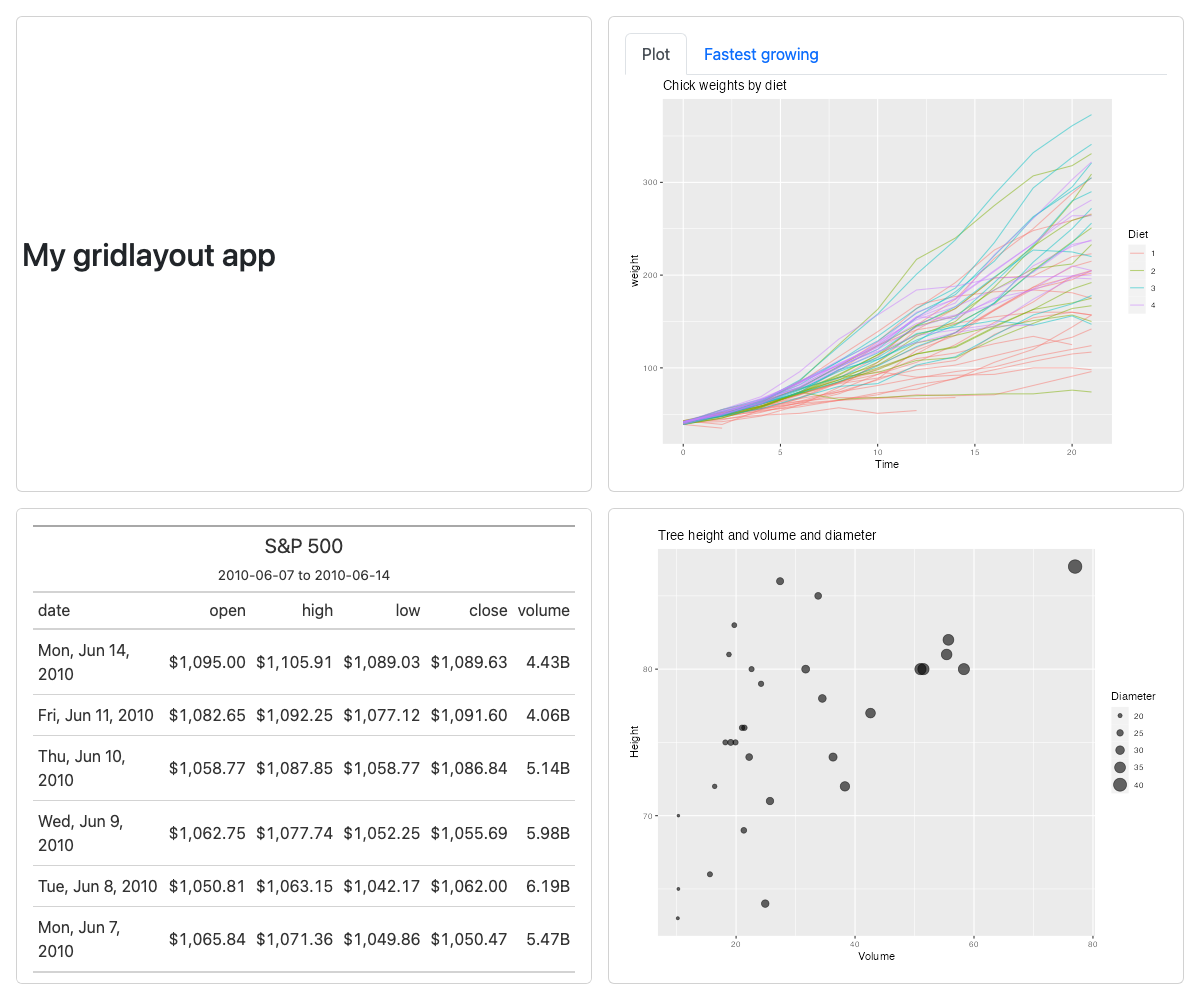
Focal chart – top
my_layout <- new_gridlayout("
  |1rem |1fr       |1fr      |
  |80px |header    |header   |
  |2fr  |chickens  |chickens |
|1fr |treePlot |stockTable |") 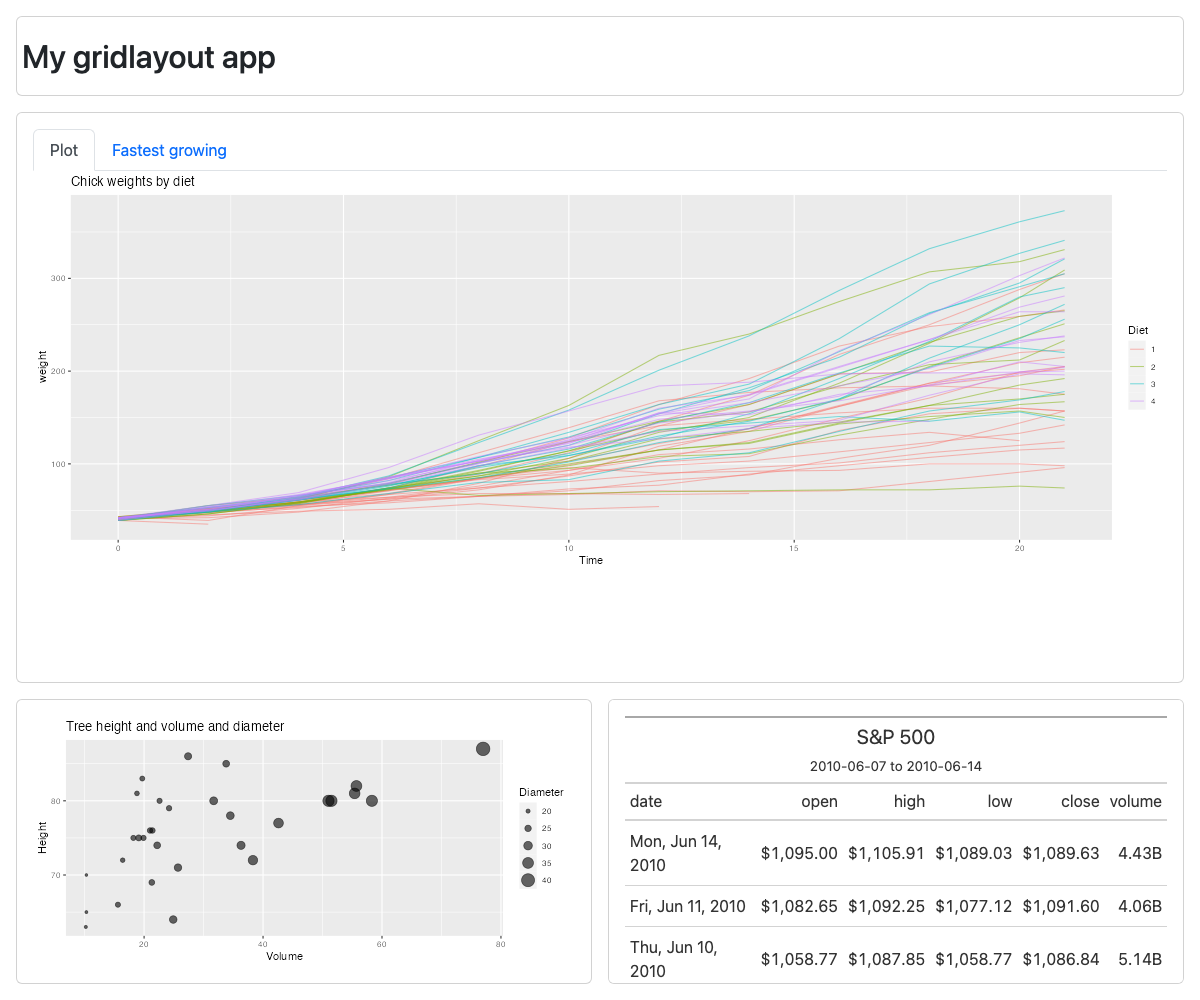
Focal chart – side
my_layout <- new_gridlayout("
  |1rem |2fr      |1fr      |
  |80px |header   |header   |
  |1fr  |chickens |treePlot |
|1fr |chickens |stockTable |") 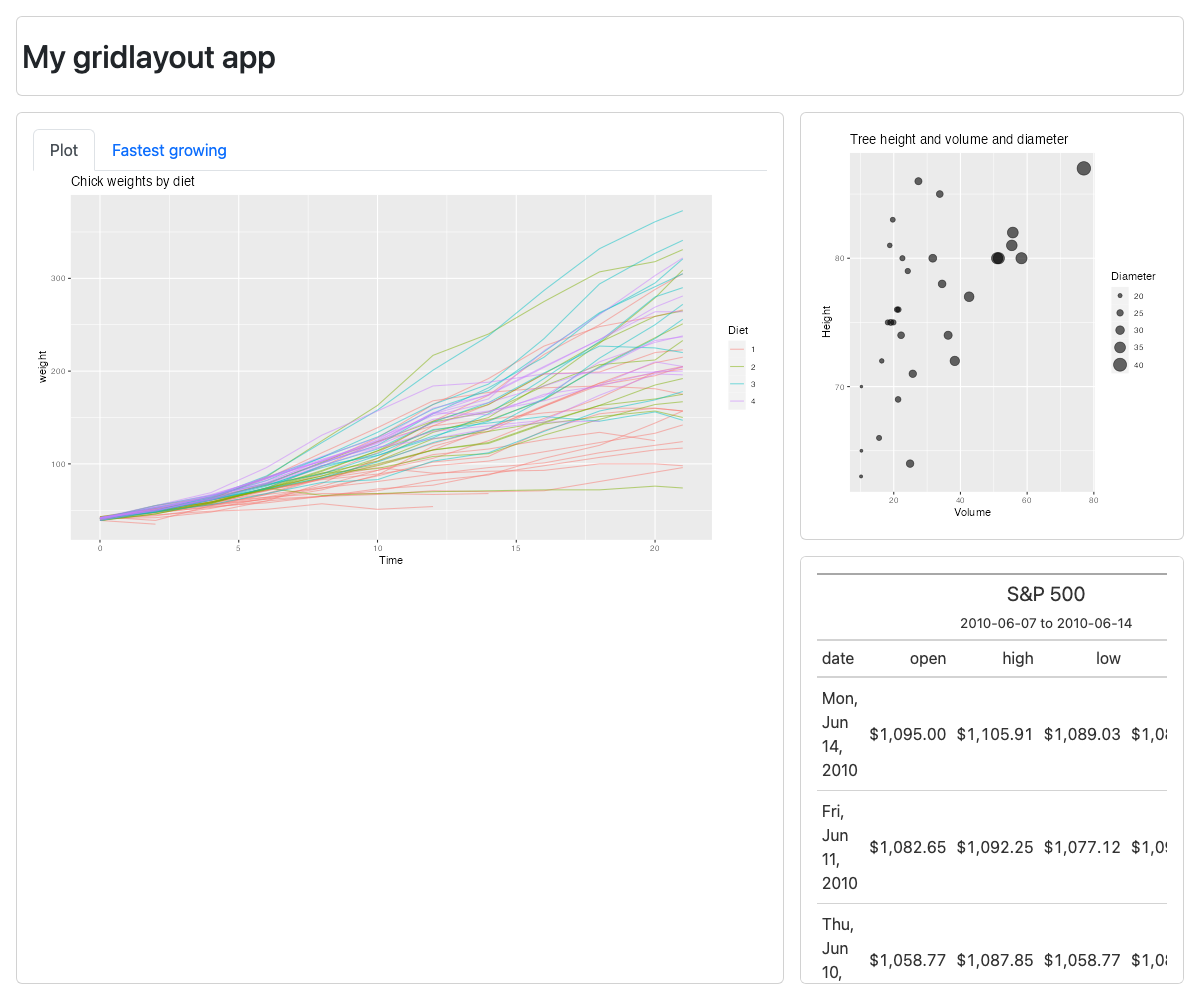
Full app code
The following is the function used to generate the apps shown above. Simply pass your layout of interest as an argument (or unwrap from the function entirely.)
library(gridlayout)
library(shiny)
library(ggplot2)
library(gt)
library(dplyr)
library(bslib)

app_w_layout <- function(my_layout) {
  shinyApp(
    ui = grid_page(
      layout = my_layout,
      grid_card_text("header", "My gridlayout app"),
      grid_card(
        "chickens",
        card_body(
          tabsetPanel(
            tabPanel("Plot", plotOutput("chickPlot")),
            tabPanel("Fastest growing", gt_output("chickTable")),
          )
        )
      ),
      grid_card_plot("treePlot"),
      grid_card(
         "stockTable",
        gt_output("stockTable")
      ),
      flag_mismatches = FALSE # Allows us to use layouts without some elements declared
    ),
    server = function(input, output) {

      output$chickPlot <- renderPlot({
        ggplot(
          ChickWeight,
          aes(
            x = Time,
            y = weight,
            group = Chick,
            color = Diet
          )
        ) +
          geom_line(alpha = 0.5) +
          ggtitle("Chick weights by diet")
      })

      output$chickTable <- render_gt({
        ChickWeight %>%
          group_by(Chick) %>%
          summarise(
            `Diet` = first(Diet),
            `start weight` = first(weight),
            `end weight` = last(weight),
            `weight change rate` = (last(weight) - first(weight)) / last(Time)
          ) %>%
          arrange(desc(`weight change rate`)) %>%
          head(8) %>%
          gt() %>%
          tab_header(
            title = "8 fastest growing chicks"
          ) %>%
          fmt_number(
            columns = c(`start weight`,`end weight`),
            pattern = "{x}<sub>g</sub>",
            decimals = 1
          ) %>%
          fmt_number(
            columns = c(`weight change rate`),
            pattern = "{x}<sub>g/day</sub>",
            decimals = 2
          )
      },
      height = "100%",
      width = "100%")

      output$treePlot <- renderPlot({
        ggplot(
          trees,
          aes(y = Height, x = Volume, size = Girth*2)
        ) +
          geom_point(alpha = 0.6) +
          scale_radius() +
          labs(
            title = "Tree height and volume and diameter",
            size = "Diameter"
          )
      })

      output$yarnPlot <- renderPlot({
        ggplot(
          warpbreaks,
          aes(x = breaks, fill = wool)
        ) +
          geom_dotplot(binwidth = 1, method = "histodot") +
          facet_grid(tension ~ .) +
          scale_y_continuous(NULL, breaks = NULL) +
          ggtitle("Breaks in different yarns by tension")
      })

      output$stockTable <- render_gt({
        # Define the start and end dates for the data range
        start_date <- "2010-06-07"
        end_date <- "2010-06-14"

        # Create a gt table based on preprocessed
        # `sp500` table data
        sp500 %>%
          filter(date >= start_date & date <= end_date) %>%
          select(-adj_close) %>%
          gt() %>%
          tab_header(
            title = "S&P 500",
            subtitle = glue::glue("{start_date} to {end_date}")
          ) %>%
          fmt_date(
            columns = date,
            date_style = 3
          ) %>%
          fmt_currency(
            columns = c(open, high, low, close),
            currency = "USD"
          ) %>%
          fmt_number(
            columns = volume,
            suffixing = TRUE
          )
      },
      height = "100%",
      width = "100%")
    }
  )
}