With the Information Management workflow, table information can be synthesized, giving us a snapshot of a data table we care to collect information on. The pointblank informant is given a series of information functions to define portions of information about a table. This info text can pertain to individual columns, the table as a whole, and whatever additional information makes sense for your organization. We can even glean little snippets of information from the target table and mix them into the info text to make the overall information more dynamic.
Starting with a Simple Example
This workflow is somewhat similar in concept and usage to the
Data Quality Reporting Workflow
(VALID-I). Instead of an agent, we use an
informant and we get that informant with the
create_informant() function. We point the
informant to a target table and this can be a data frame, a
tibble, a database table (as a tbl_dbi object), or a Spark
DataFrame (as a tbl_spark object).
The small_table dataset is included in the
pointblank package. It’s a small, uninteresting dataset
but it’s useful for simple examples. This is what it looks like:
small_table## # A tibble: 13 × 8
## date_time date a b c d e f
## <dttm> <date> <int> <chr> <dbl> <dbl> <lgl> <chr>
## 1 2016-01-04 11:00:00 2016-01-04 2 1-bcd-345 3 3423. TRUE high
## 2 2016-01-04 00:32:00 2016-01-04 3 5-egh-163 8 10000. TRUE low
## 3 2016-01-05 13:32:00 2016-01-05 6 8-kdg-938 3 2343. TRUE high
## 4 2016-01-06 17:23:00 2016-01-06 2 5-jdo-903 NA 3892. FALSE mid
## 5 2016-01-09 12:36:00 2016-01-09 8 3-ldm-038 7 284. TRUE low
## 6 2016-01-11 06:15:00 2016-01-11 4 2-dhe-923 4 3291. TRUE mid
## 7 2016-01-15 18:46:00 2016-01-15 7 1-knw-093 3 843. TRUE high
## 8 2016-01-17 11:27:00 2016-01-17 4 5-boe-639 2 1036. FALSE low
## 9 2016-01-20 04:30:00 2016-01-20 3 5-bce-642 9 838. FALSE high
## 10 2016-01-20 04:30:00 2016-01-20 3 5-bce-642 9 838. FALSE high
## 11 2016-01-26 20:07:00 2016-01-26 4 2-dmx-010 7 834. TRUE low
## 12 2016-01-28 02:51:00 2016-01-28 2 7-dmx-010 8 108. FALSE low
## 13 2016-01-30 11:23:00 2016-01-30 1 3-dka-303 NA 2230. TRUE highLet’s use the small_table object and see what results
from introducing it to the informant.
informant <-
  create_informant(
    tbl = small_table,
    tbl_name = "small_table",
    label = "Example No. 1"
  )
Printing the informant will show us the
automatically-generated information on the small_table
dataset, adding the Columns section.
informant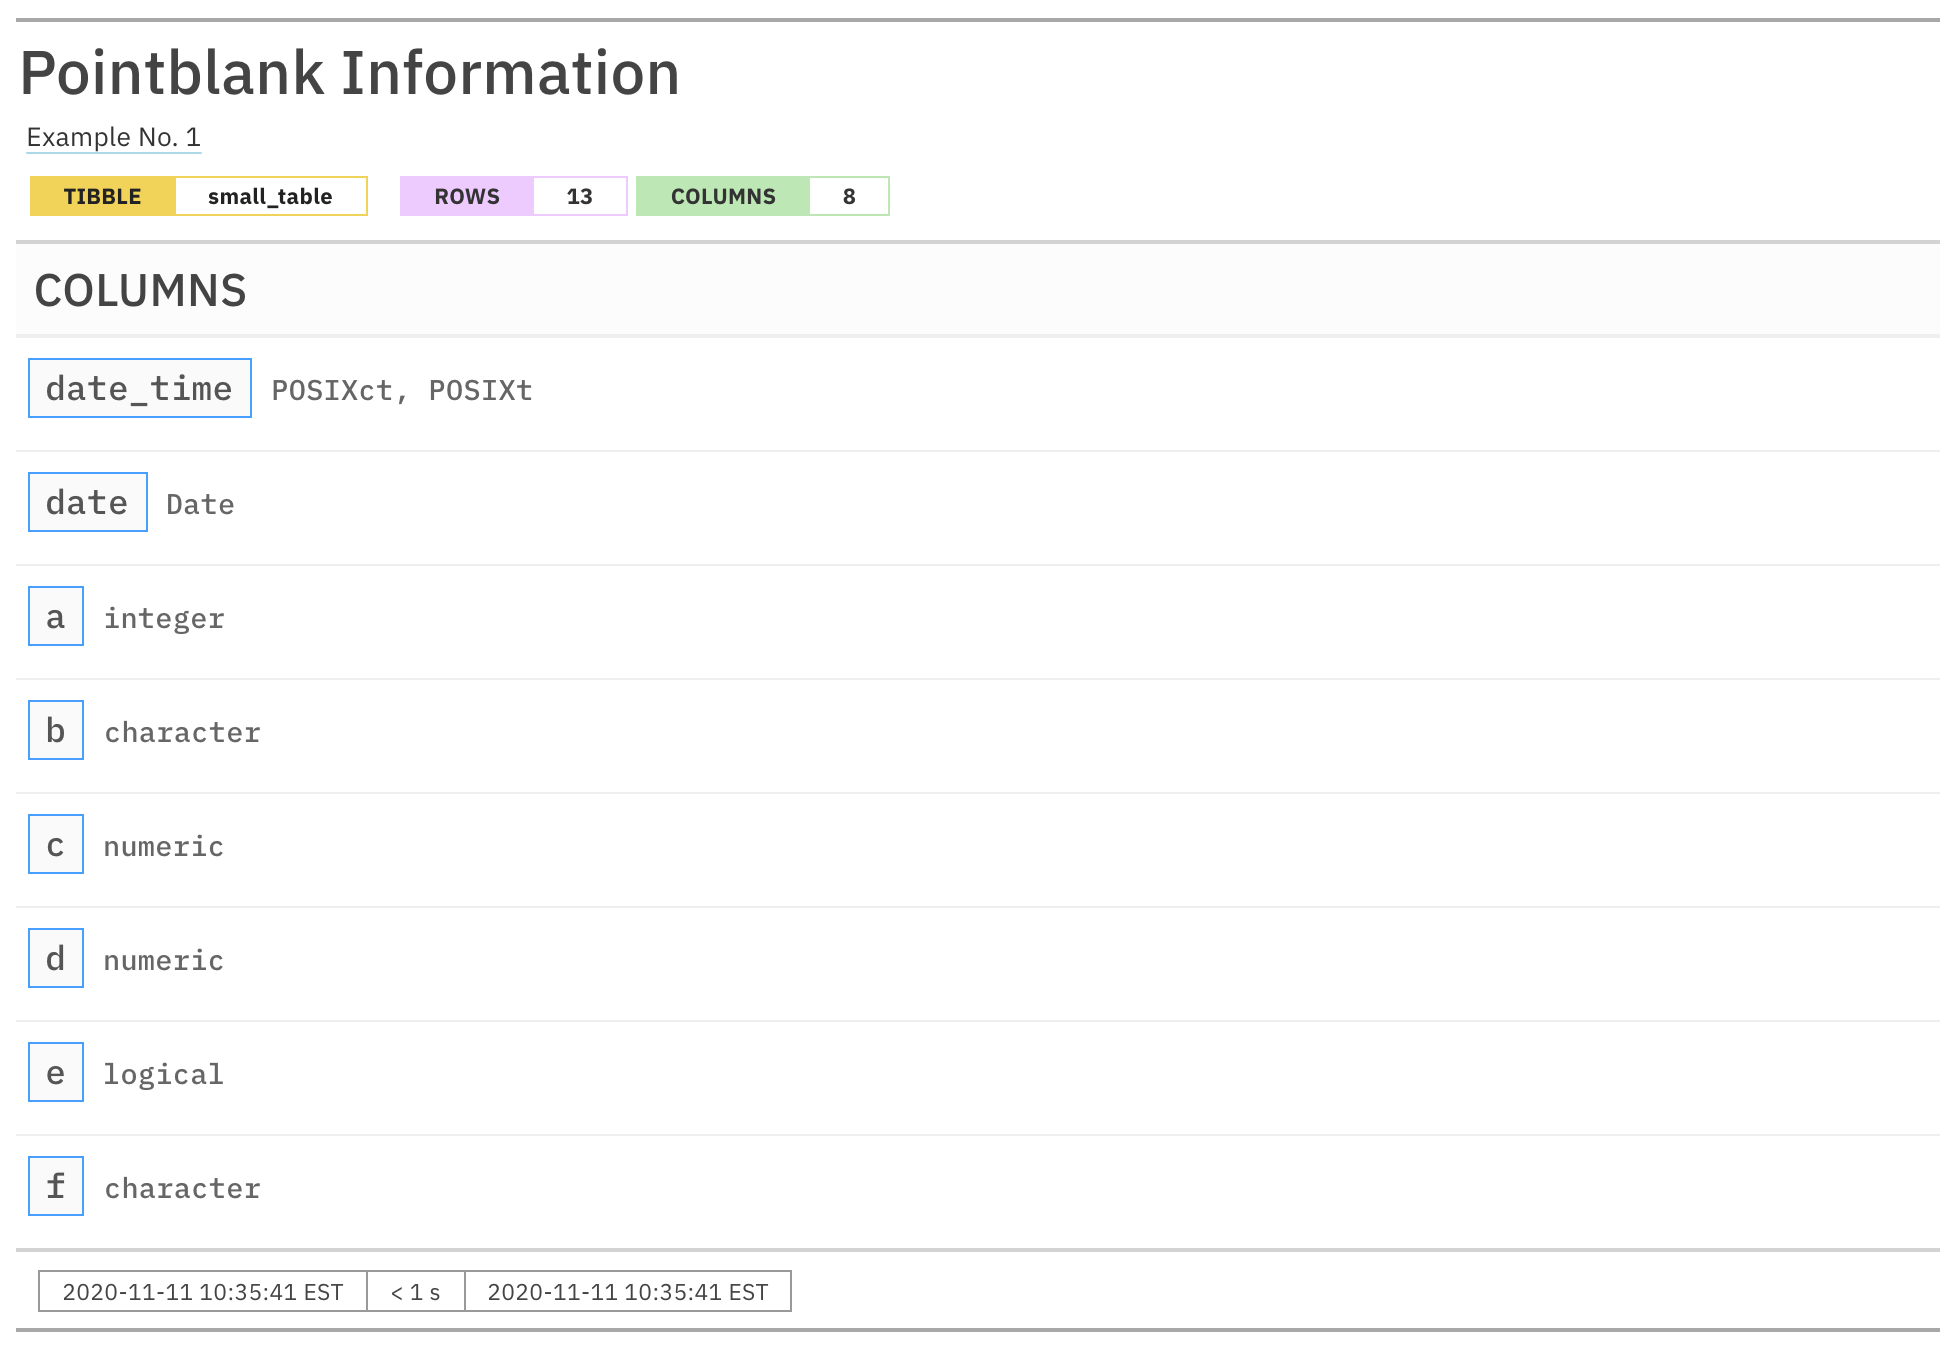
Alternatively we can get the same report with
get_informant_report() and have access to additional output
options, like producing a narrower version of the output.
get_informant_report(informant, size = "small")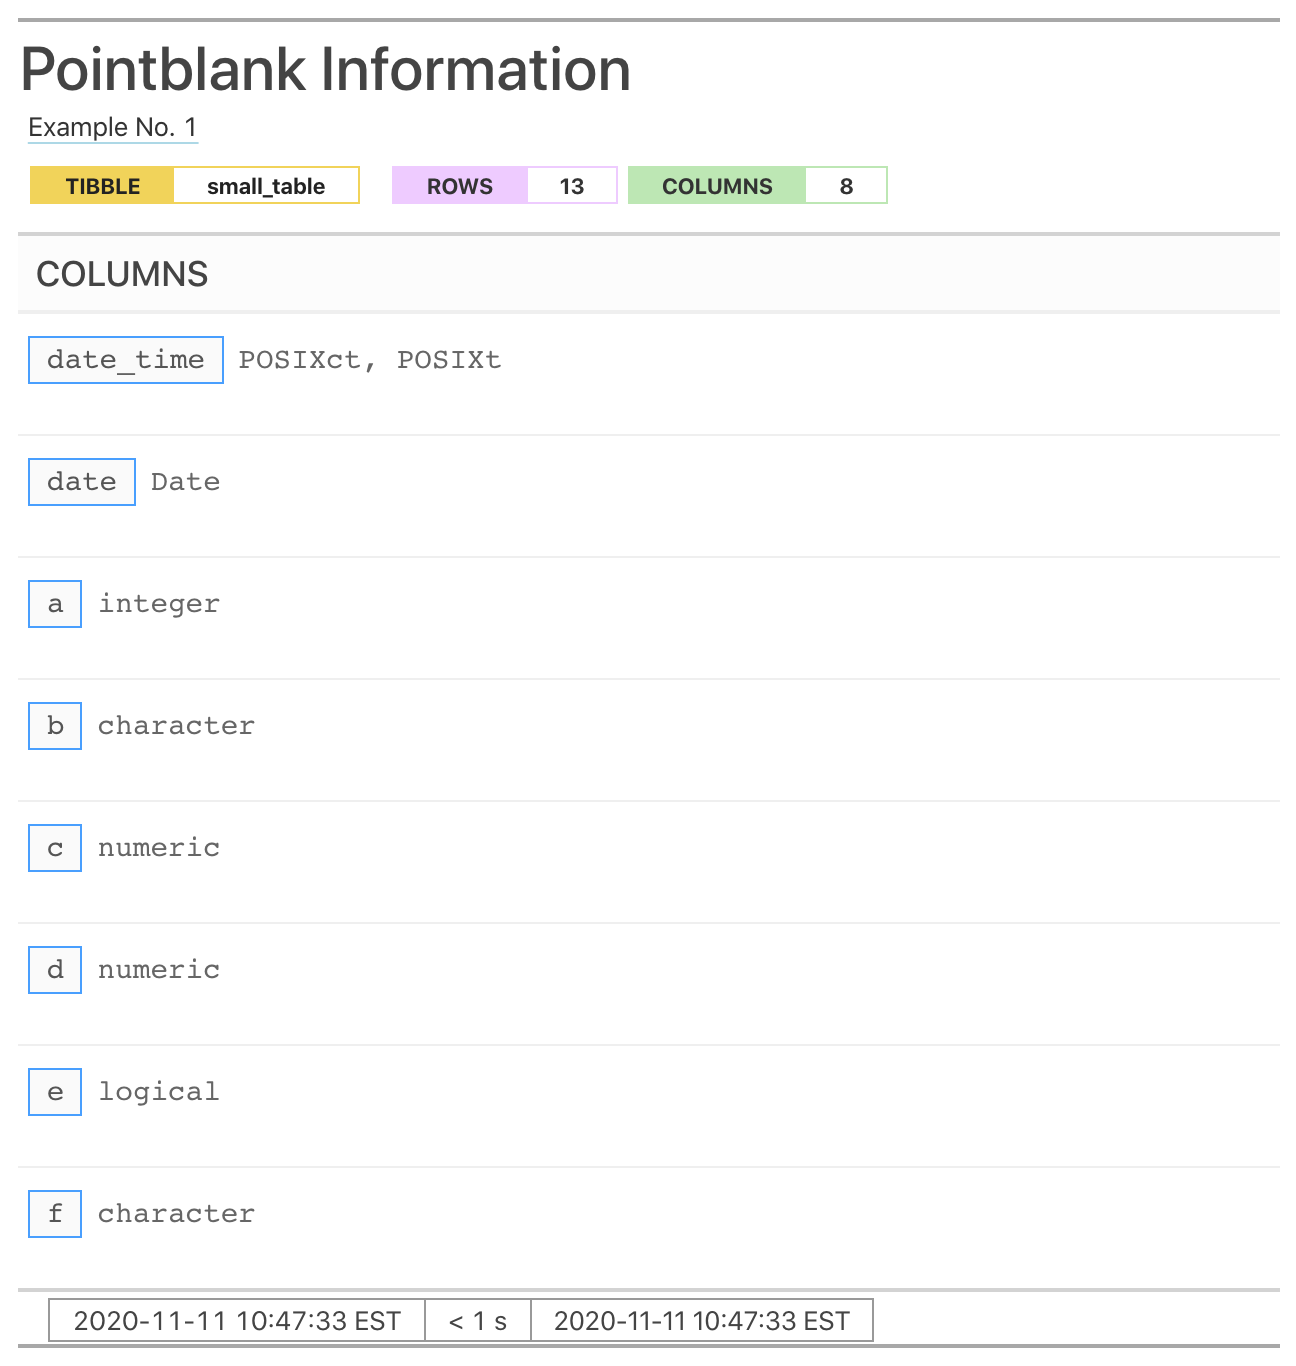
Either way, what we get in the initial reporting is very basic. What
should be done next is to add information with the following set of
info_*() functions:
-
info_tabular(): Add information that focuses on aspects of the data table as a whole -
info_columns(): Add information that focuses on aspects of a data table’s columns -
info_section(): Add information that focuses on some key aspect of the data table
Let’s try adding some information with each of these functions and then look at the resulting report.
informant <-
  create_informant(
    tbl = small_table,
    tbl_name = "small_table",
    label = "Example No. 2"
  ) %>%
  info_tabular(
    description = "This table is included in the **pointblank** pkg."
  ) %>%
  info_columns(
    columns = date_time,
    info = "This column is full of timestamps."
  ) %>%
  info_section(
    section_name = "further information",
    `examples and documentation` = "Examples for how to use the `info_*()` functions
    (and many more) are available at the
    [**pointblank** site](https://rstudio.github.io/pointblank/)."
  )

informant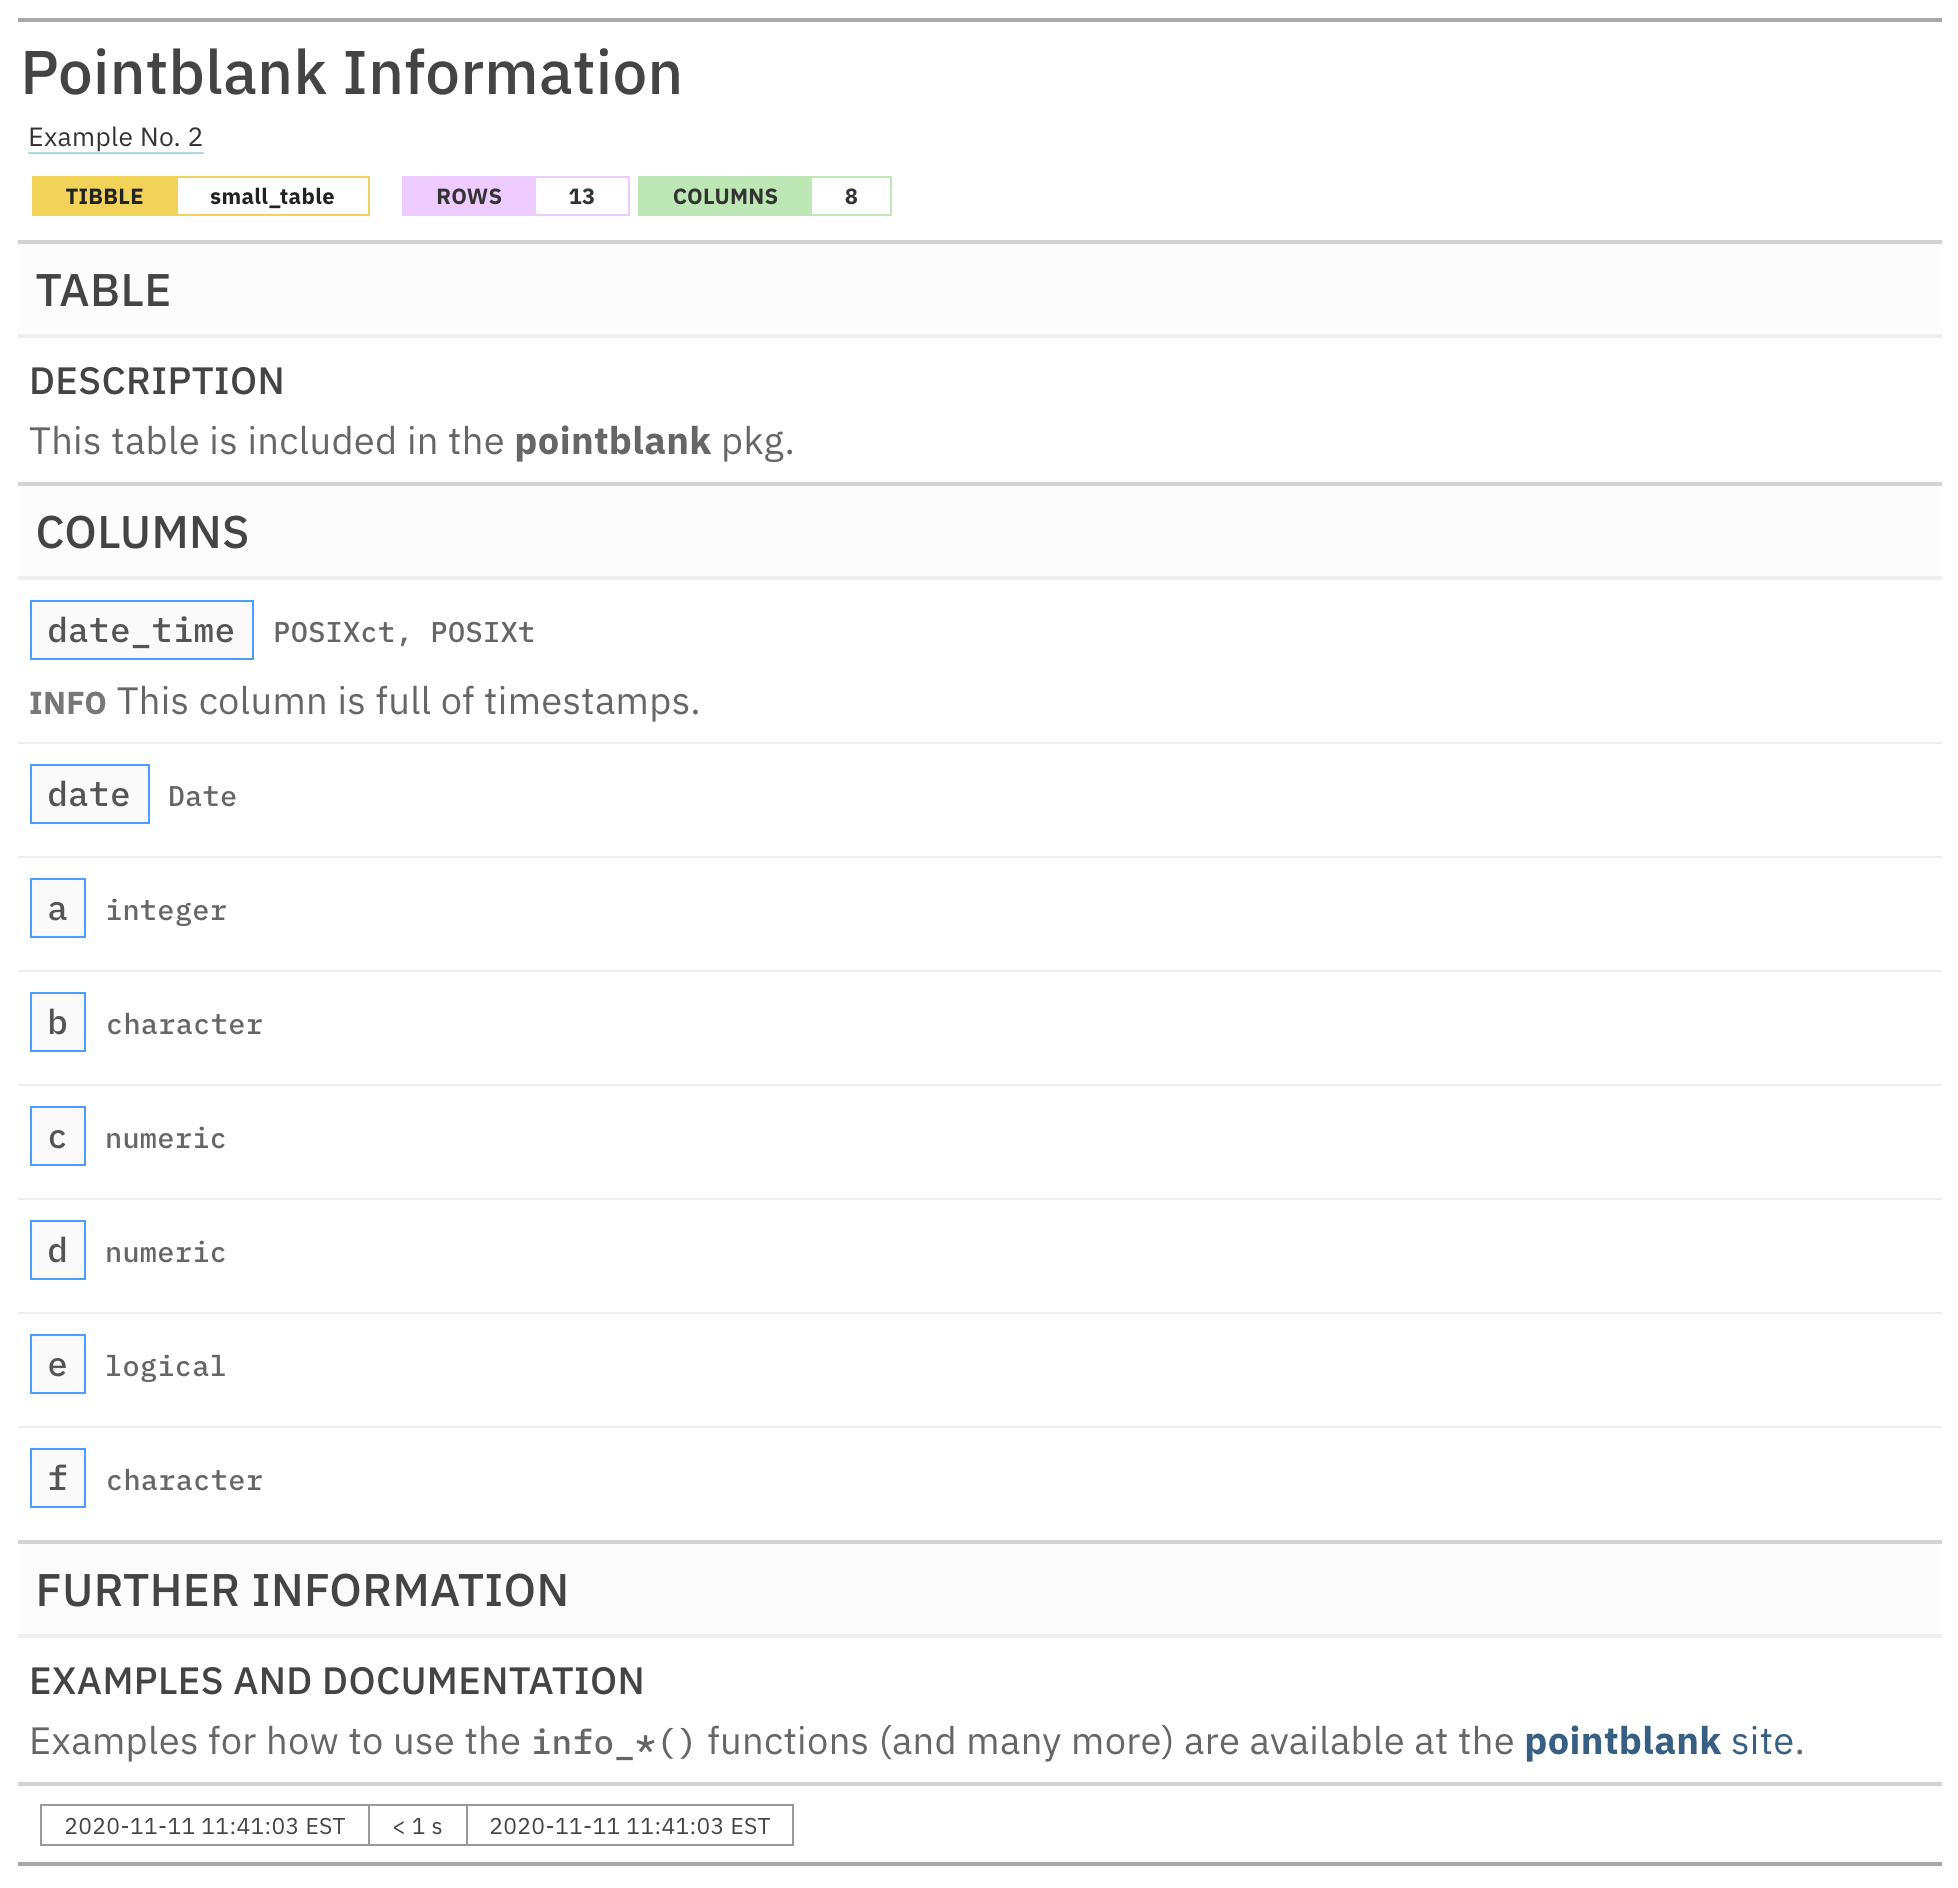
As can be seen, the report is a bit more filled out with information.
The TABLE and COLUMNS sections are in
their prescribed order and the new section we named FURTHER
INFORMATION follows those (and it has one subsection called
EXAMPLES and DOCUMENTATION). Let’s explore how each of
the three different info_*() functions work.
The TABLE Section and
info_tabular()
The info_tabular() function adds information to the
TABLE section. We use named arguments to define
subsection names and their content. In the previous example
info_tabular(description = "This table is included in the **pointblank** pkg.")
was used to make the DESCRIPTION subsection (all
section titles are automatically capitalized), and the info
text is the Markdown text
"This table is included in the **pointblank** pkg.". We can
define as many subsections to the TABLE section as we
need, either in the same info_tabular() call or across
multiple calls. If we want to use more complicated subsection names than
a single word, then we can enclose that text in back ticks. For example,
why not put some emoji in your subsection name?
informant %>%
  info_tabular("🔄 updates" = "This table is not regularly updated.")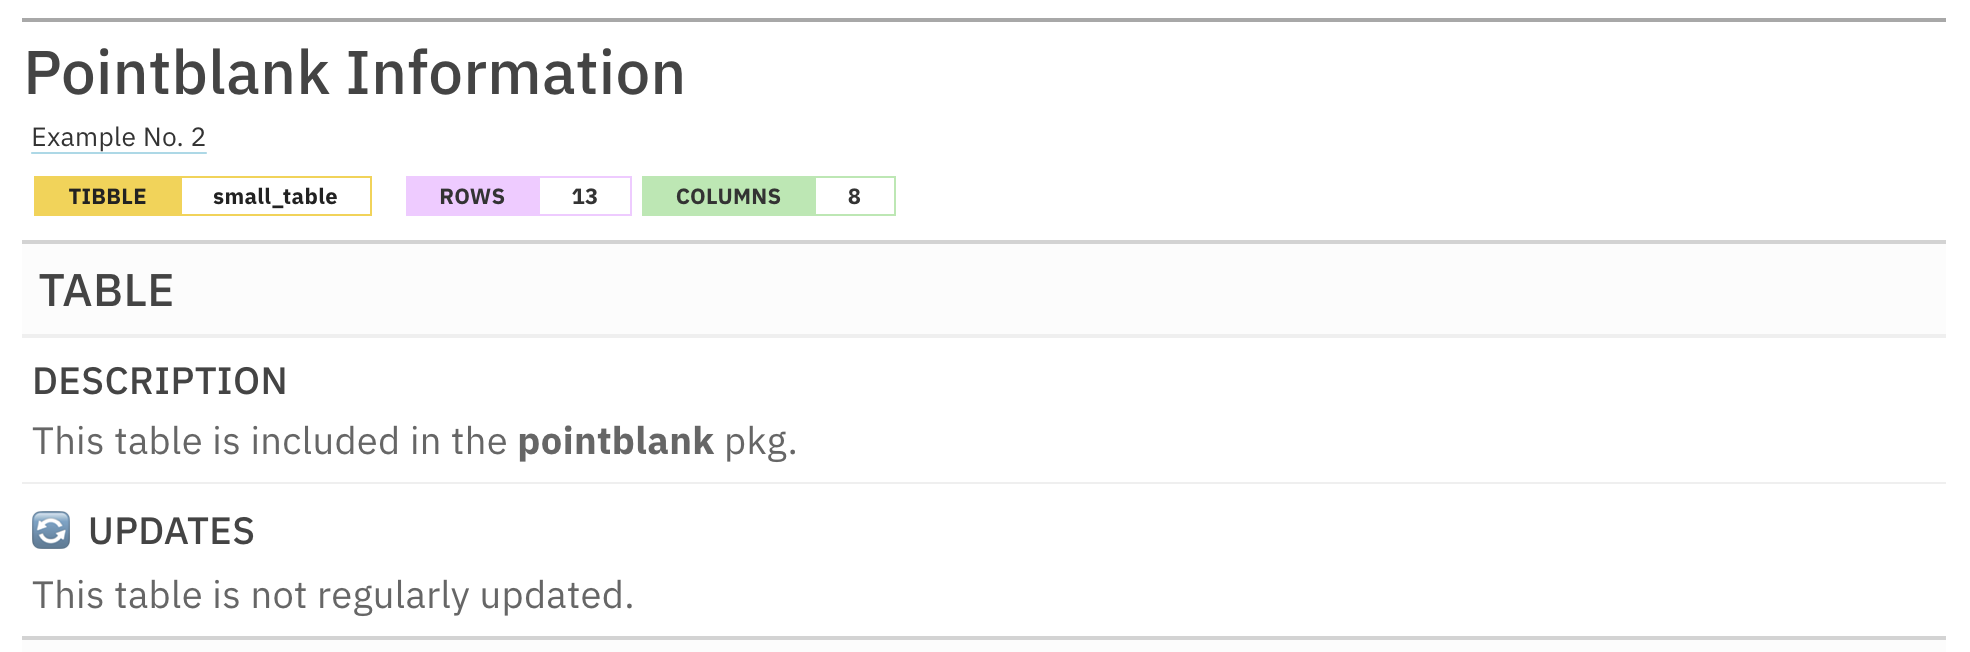
This is an excerpt of the complete report, showing just the report header and the TABLE section.
The TABLE section is a great place to put all the information about the table that needs to be front and center. Examples of some useful topics for this section might include:
- a high-level summary of the table, stating its purpose and importance
- what each row of the table represents
- the main users of the table within an organization
- description of how the table is generated
- information on the frequency of updates
The COLUMNS Section and
info_columns()
The section that follows the TABLE section is
COLUMNS. This section provides an opportunity to
describe each table column in as much detail as necessary. Here,
individual columns serve as subsections (automatically generated upon
using create_informant()) and there can be subsections
within each column as well.
The interesting thing about the information provided here via
info_columns() is that the information is additive. We can
make multiple calls of info_columns() and disperse common
pieces of info text to multiple columns and append the text to
any existing. Let’s take a look at this in practice with the far more
interesting palmerpenguins::penguins dataset. Here, we fill
in information for each column by adapting documentation
from the palmerpenguins package.
informant_pp <-
  create_informant(
    tbl = palmerpenguins::penguins,
    tbl_name = "penguins",
    label = "The `penguins` dataset from the **palmerpenguins** 📦."
  ) %>%
  info_columns(
    columns = species,
    `ℹ️` = "A factor denoting penguin species (*Adélie*, *Chinstrap*, and *Gentoo*)."
  ) %>%
  info_columns(
    columns = island,
    `ℹ️` = "A factor denoting island in Palmer Archipelago, Antarctica
    (*Biscoe*, *Dream*, or *Torgersen*)."
  ) %>%
  info_columns(
    columns = bill_length_mm,
    `ℹ️` = "A number denoting bill length"
  ) %>%
  info_columns(
    columns = bill_depth_mm,
    `ℹ️` = "A number denoting bill depth"
  ) %>%
  info_columns(
    columns = flipper_length_mm,
    `ℹ️` = "An integer denoting flipper length"
  ) %>%
  info_columns(
    columns = ends_with("mm"),
    `ℹ️` = "(in units of millimeters)."
  ) %>%
  info_columns(
    columns = body_mass_g,
    `ℹ️` = "An integer denoting body mass (grams)."
  ) %>%
  info_columns(
    columns = sex,
    `ℹ️` = "A factor denoting penguin sex (`\"female\"`, `\"male\"`)."
  ) %>%
  info_columns(
    columns = year,
    `ℹ️` = "The study year (e.g., `2007`, `2008`, `2009`)."
  )

informant_pp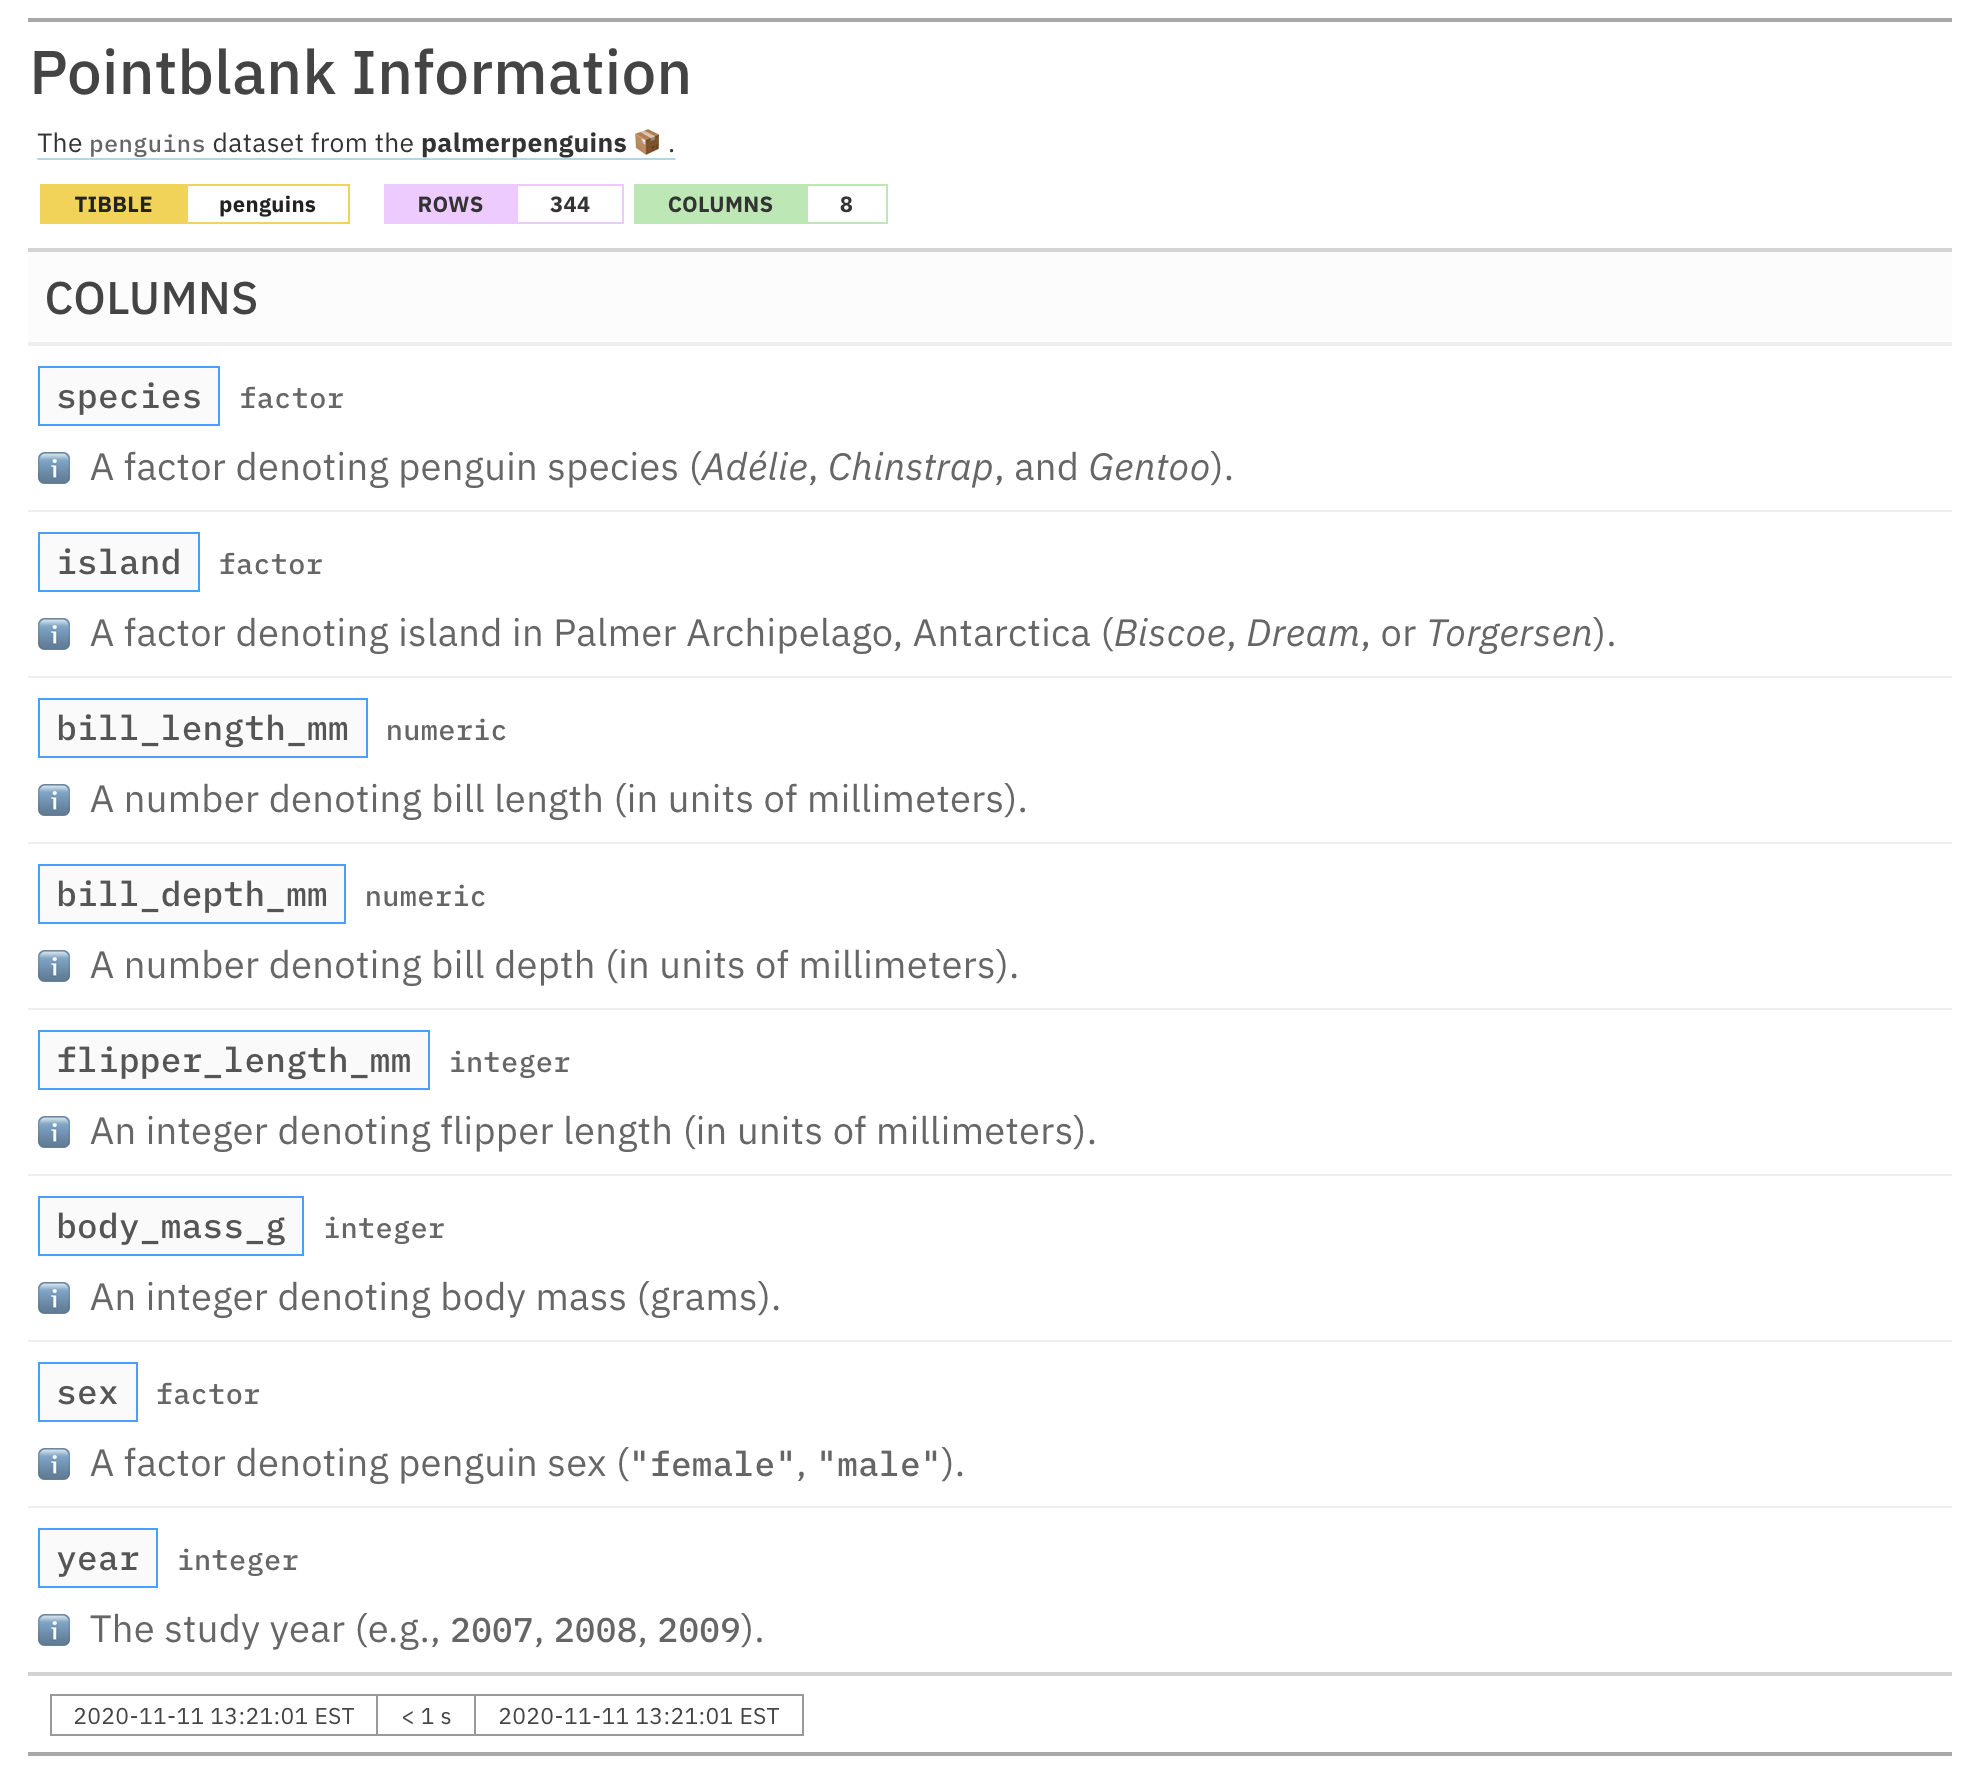
We are able to provide subsections with the name ℹ️ and,
furthermore, use tidyselect functions like
ends_with() to append info text to a common
subsection that exists across multiple columns. This was useful for
stating the units which were common across three columns:
bill_length_mm, bill_depth_mm, and
flipper_length_mm. The following
tidyselect functions are available in
pointblank to make this process easier:
-
starts_with(): Match columns that start with a prefix. -
ends_with(): Match columns that end with a suffix. -
contains(): Match columns that contain a literal string. -
matches(): Perform matching with a regular expression. -
everything(): Select all columns.
Extra Sections and info_section()
For all that information that we can’t or don’t want to put in the
TABLE or COLUMNS sections, we can
place it extra sections (and their subsections) with the
info_section() function. These sections go below the
aforementioned sections in the order of creation. Let’s put together
some extra sections that further describe the
palmerpenguins::penguins dataset.
informant_pp <-
  informant_pp %>%
  info_section(
    section_name = "source",
    "References" = c(
"- Adélie penguins: Palmer Station Antarctica LTER and K. Gorman. 2020. Structural
size measurements and isotopic signatures of foraging among adult male and female
Adélie penguins (Pygoscelis adeliae) nesting along the Palmer Archipelago near
Palmer Station, 2007-2009 ver 5. Environmental Data Initiative
<https://doi.org/10.6073/pasta/98b16d7d563f265cb52372c8ca99e60f>",

"- Gentoo penguins: Palmer Station Antarctica LTER and K. Gorman. 2020. Structural
size measurements and isotopic signatures of foraging among adult male and female
Gentoo penguin (Pygoscelis papua) nesting along the Palmer Archipelago near Palmer
Station, 2007-2009 ver 5. Environmental Data Initiative
<https://doi.org/10.6073/pasta/7fca67fb28d56ee2ffa3d9370ebda689>",

"- Chinstrap penguins: Palmer Station Antarctica LTER and K. Gorman. 2020.
Structural size measurements and isotopic signatures of foraging among adult male
and female Chinstrap penguin (Pygoscelis antarcticus) nesting along the Palmer
Archipelago near Palmer Station, 2007-2009 ver 6. Environmental Data Initiative
<https://doi.org/10.6073/pasta/c14dfcfada8ea13a17536e73eb6fbe9e>
"
    ),
    "Note" = "
Originally published in: Gorman KB, Williams TD, Fraser WR (2014) Ecological Sexual
Dimorphism and Environmental Variability within a Community of Antarctic Penguins
(Genus Pygoscelis). PLoS ONE 9(3): e90081. doi:10.1371/journal.pone.0090081
"
)

informant_pp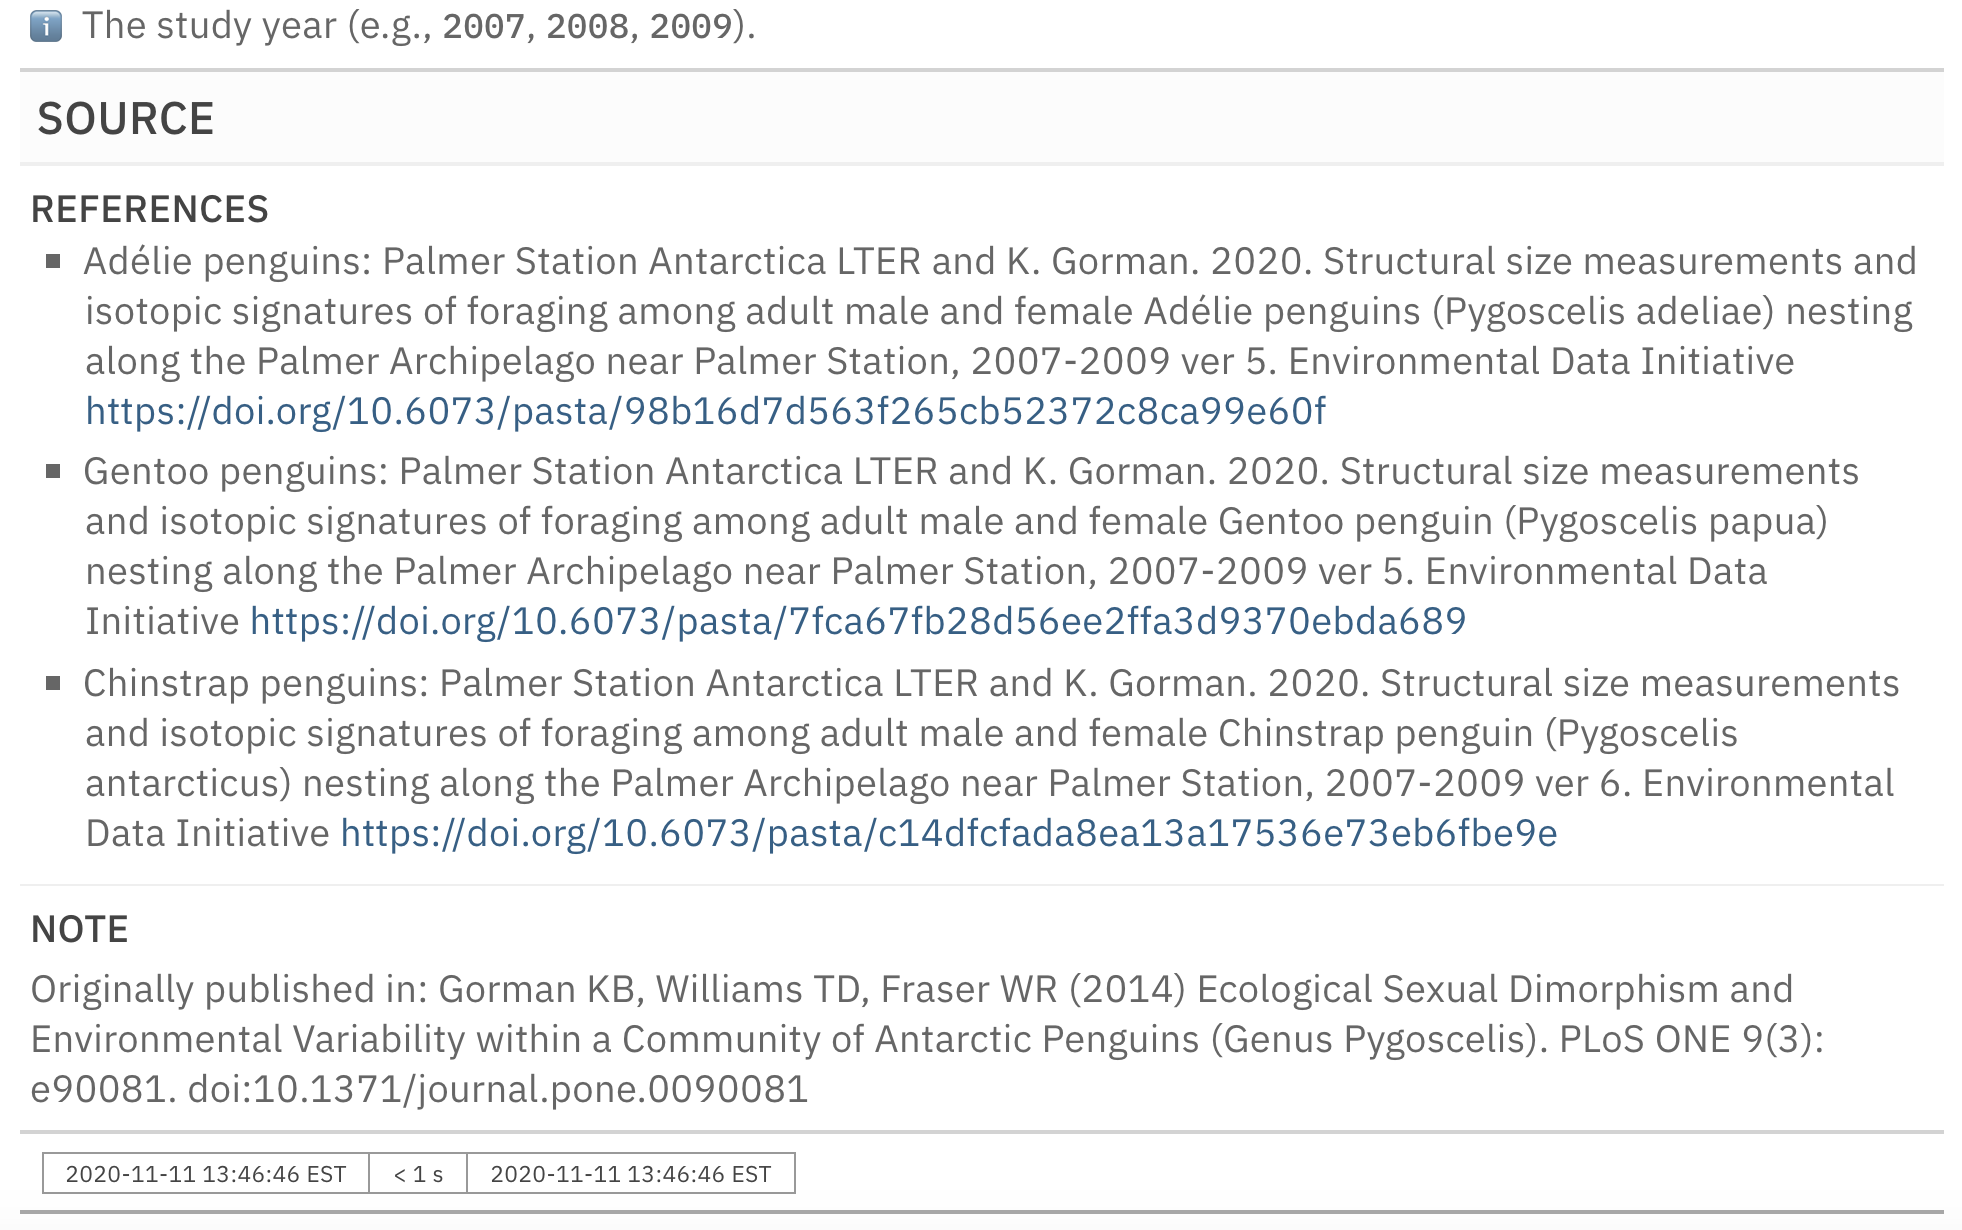
This is an excerpt of the complete report, showing just the SOURCE section and the footer.
What other types of information go well in these separate sections? Some ideas are:
- any info related to the source of the data table (e.g., references, background, etc.)
- definitions/explanations of terms used above
- persons responsible for the data table, perhaps with contact information
- further details on how the table is produced
- any important issues with the table and notes on upcoming changes
- links to other information artifacts that pertain to the table
- information to do with the report itself (how meta!); this might include things like the update history, persons responsible, instructions on how to contribute, etc.
Really, the sky is the limit here! We can incorporate a great deal of useful information here and use this process to generate reports on all of the important tables within an organization. But there’s more that can be done. To do that you have to go on to the the next phase (the Advanced Information Management article).
You have to go all the way now, total transformation. Do you think you’re ready?