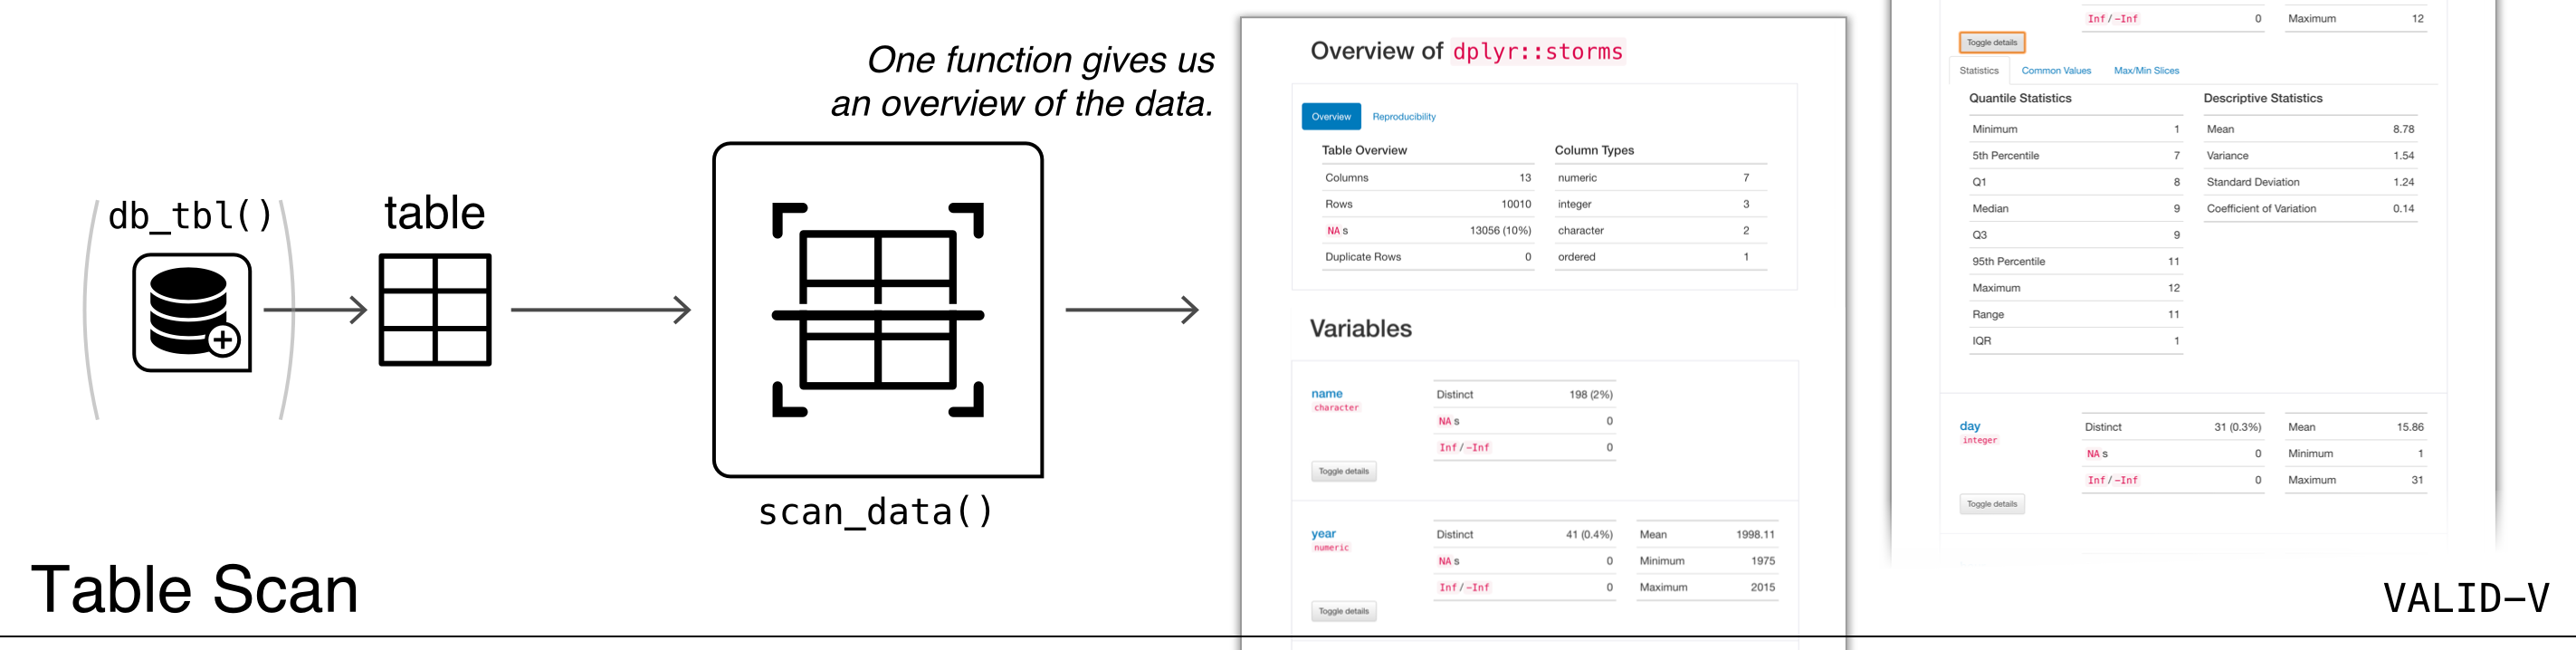
The VALID-V: Table Scan workflow consists of a single
function: scan_data(). So simple, and it gives you so much
information on a data table. The function generates an HTML report that
scours the input table data. This is great to use before diving into the
other workflows because it’s a good idea to first understand the target
table with some level of precision.
The reporting output contains several sections to make everything more digestible, and these are:
- Overview: Shows table dimensions, duplicate row counts, column types, and reproducibility information
- Variables: Provides a summary for each table variable and further statistics and summaries depending on the variable type
- Interactions: Displays a matrix plot that describes the interactions between variables
- Correlations: This is a set of correlation matrix plots for numerical variables
- Missing Values: A summary figure that shows the degree of missingness across variables
- Sample: A table that provides the head and tail rows of the dataset
An Example with the Palmer Penguins Dataset
The output HTML report will appear in the RStudio Viewer and can also
be integrated in R Markdown HTML output. Here’s an
example that uses the penguins_raw dataset from the
palmerpenguins package. In the scan_data()
call, the option to deactivate the display of the navigation bar has
been taken with navbar = FALSE, which makes some sense when
integrating this type of output in a larger document.
scan_data(palmerpenguins::penguins_raw, navbar = FALSE)As could be seen, the first two sections had a lot of additional
information tucked behind detail views (with the
Toggle details buttons) and within tab sets. Should this
amount of information be a little overwhelming, there is the option to
disable one or more sections. With scan_data()’s
sections argument, you can specify just the sections that
are needed for a specific scan.
The default value for sections is the string
"OVICMS" and each letter of that stands for the following
sections in their default order:
-
"O":"overview" -
"V":"variables" -
"I":"interactions" -
"C":"correlations" -
"M":"missing" -
"S":"sample".
This string can contain less key characters and the order can be
changed to suit the desired layout of the report. For example, if you
just need the Overview, a Sample, and the
description of Variables in the target table, the string to
use for sections would be "OSV".
Just as with all the other workflows, the tbl supplied
could be a data frame, tibble, a tbl_dbi object, or a
tbl_spark object. However, there is one limitation here for
scan_data(): for tbl_dbi and
tbl_spark objects, the Interactions and
Correlations sections are currently excluded.
Languages and Locales
The reporting generated by scan_data() can be presented
in one of eight spoken languages: English ("en", the
default), French ("fr"), German ("de"),
Italian ("it"), Spanish ("es"), Portuguese,
("pt"), Chinese ("zh"), and Russian
("ru"). These two-letter language codes can be used as an
argument to the lang argument. When applied, all label text
and other non-data elements will be set to the language of choice. We
have checked the translations with native speakers of the respective
languages but if you find an error that should be corrected, please file an
issue.
Along with translations, numerical values that are generated as part
of the reporting (e.g., table dimensions, summary statistics, etc.) are
automatically formatted in the locale of the language (given in
lang). This can be overridden with the locale
argument which accepts a locale ID. Examples include
"en_US" for English (United States) and
"fr_FR" for French (France). More simply, this can be a
language identifier without a country designation, like
"es" for Spanish (Spain, same as "es_ES").
More than 700 locales are currently accepted.