The pointblank package is all about assessing the state of data
quality for a table. You provide the validation rules and the package
will dutifully interrogate the data and provide useful reporting. We can
use data frames, tibbles, database tables (tbl_dbi), and
Spark DataFrames (tbl_spark). Let’s walk through what data
validation looks like in pointblank.
The Basic Building Block: Validation Rules
We use a small_table for our example. We expect the
values in column a to be less than 10. We can specify this
validation rule via col_vals_lt().
data(small_table)

small_table %>%
  col_vals_lt(a, value = 10)
#> # A tibble: 13 × 8
#>    date_time           date           a b             c      d e     f
#>    <dttm>              <date>     <int> <chr>     <dbl>  <dbl> <lgl> <chr>
#>  1 2016-01-04 11:00:00 2016-01-04     2 1-bcd-345     3  3423. TRUE  high
#>  2 2016-01-04 00:32:00 2016-01-04     3 5-egh-163     8 10000. TRUE  low
#>  3 2016-01-05 13:32:00 2016-01-05     6 8-kdg-938     3  2343. TRUE  high
#>  4 2016-01-06 17:23:00 2016-01-06     2 5-jdo-903    NA  3892. FALSE mid
#>  5 2016-01-09 12:36:00 2016-01-09     8 3-ldm-038     7   284. TRUE  low
#>  6 2016-01-11 06:15:00 2016-01-11     4 2-dhe-923     4  3291. TRUE  mid
#>  7 2016-01-15 18:46:00 2016-01-15     7 1-knw-093     3   843. TRUE  high
#>  8 2016-01-17 11:27:00 2016-01-17     4 5-boe-639     2  1036. FALSE low
#>  9 2016-01-20 04:30:00 2016-01-20     3 5-bce-642     9   838. FALSE high
#> 10 2016-01-20 04:30:00 2016-01-20     3 5-bce-642     9   838. FALSE high
#> 11 2016-01-26 20:07:00 2016-01-26     4 2-dmx-010     7   834. TRUE  low
#> 12 2016-01-28 02:51:00 2016-01-28     2 7-dmx-010     8   108. FALSE low
#> 13 2016-01-30 11:23:00 2016-01-30     1 3-dka-303    NA  2230. TRUE  high
If the table fulfills the validation rule, it just return the input table - so we can directly pass that to further validation rules.
small_table %>%
  col_vals_lt(a, value = 10) %>%
  col_vals_between(d, left = 0, right = 5000) %>%
  col_vals_in_set(f, set = c("low", "mid", "high")) %>%
  col_vals_regex(b, regex = "^[0-9]-[a-z]{3}-[0-9]{3}$")
#> Error:
#> ! Exceedance of failed test units where values in `d` should have been between `0` and `5000`.
#> The `col_vals_between()` validation failed beyond the absolute threshold level (1).
#> * failure level (1) >= failure threshold (1)
One of them fails! Now we know that the data quality of the table wasn’t what we were expecting. If you are assessing the data quality to make sure no poor data is fed into a data processing pipeline or a model, this error may be all you need to stop the process.
A Simple Validation Table
If you are building a report on the state of your data quality you can capture more fine-grained information in a validation table.
This is the validation report table produced from the above
validation of small_table:
Each row in this reporting table constitutes a single validation step. Roughly, the left-hand side outlines the validation rules and the right-hand side provides the results of each validation step. While simple in principle, there’s a lot of useful information packed into this validation table.
Here’s a diagram that describes a few of the important parts of the validation table:
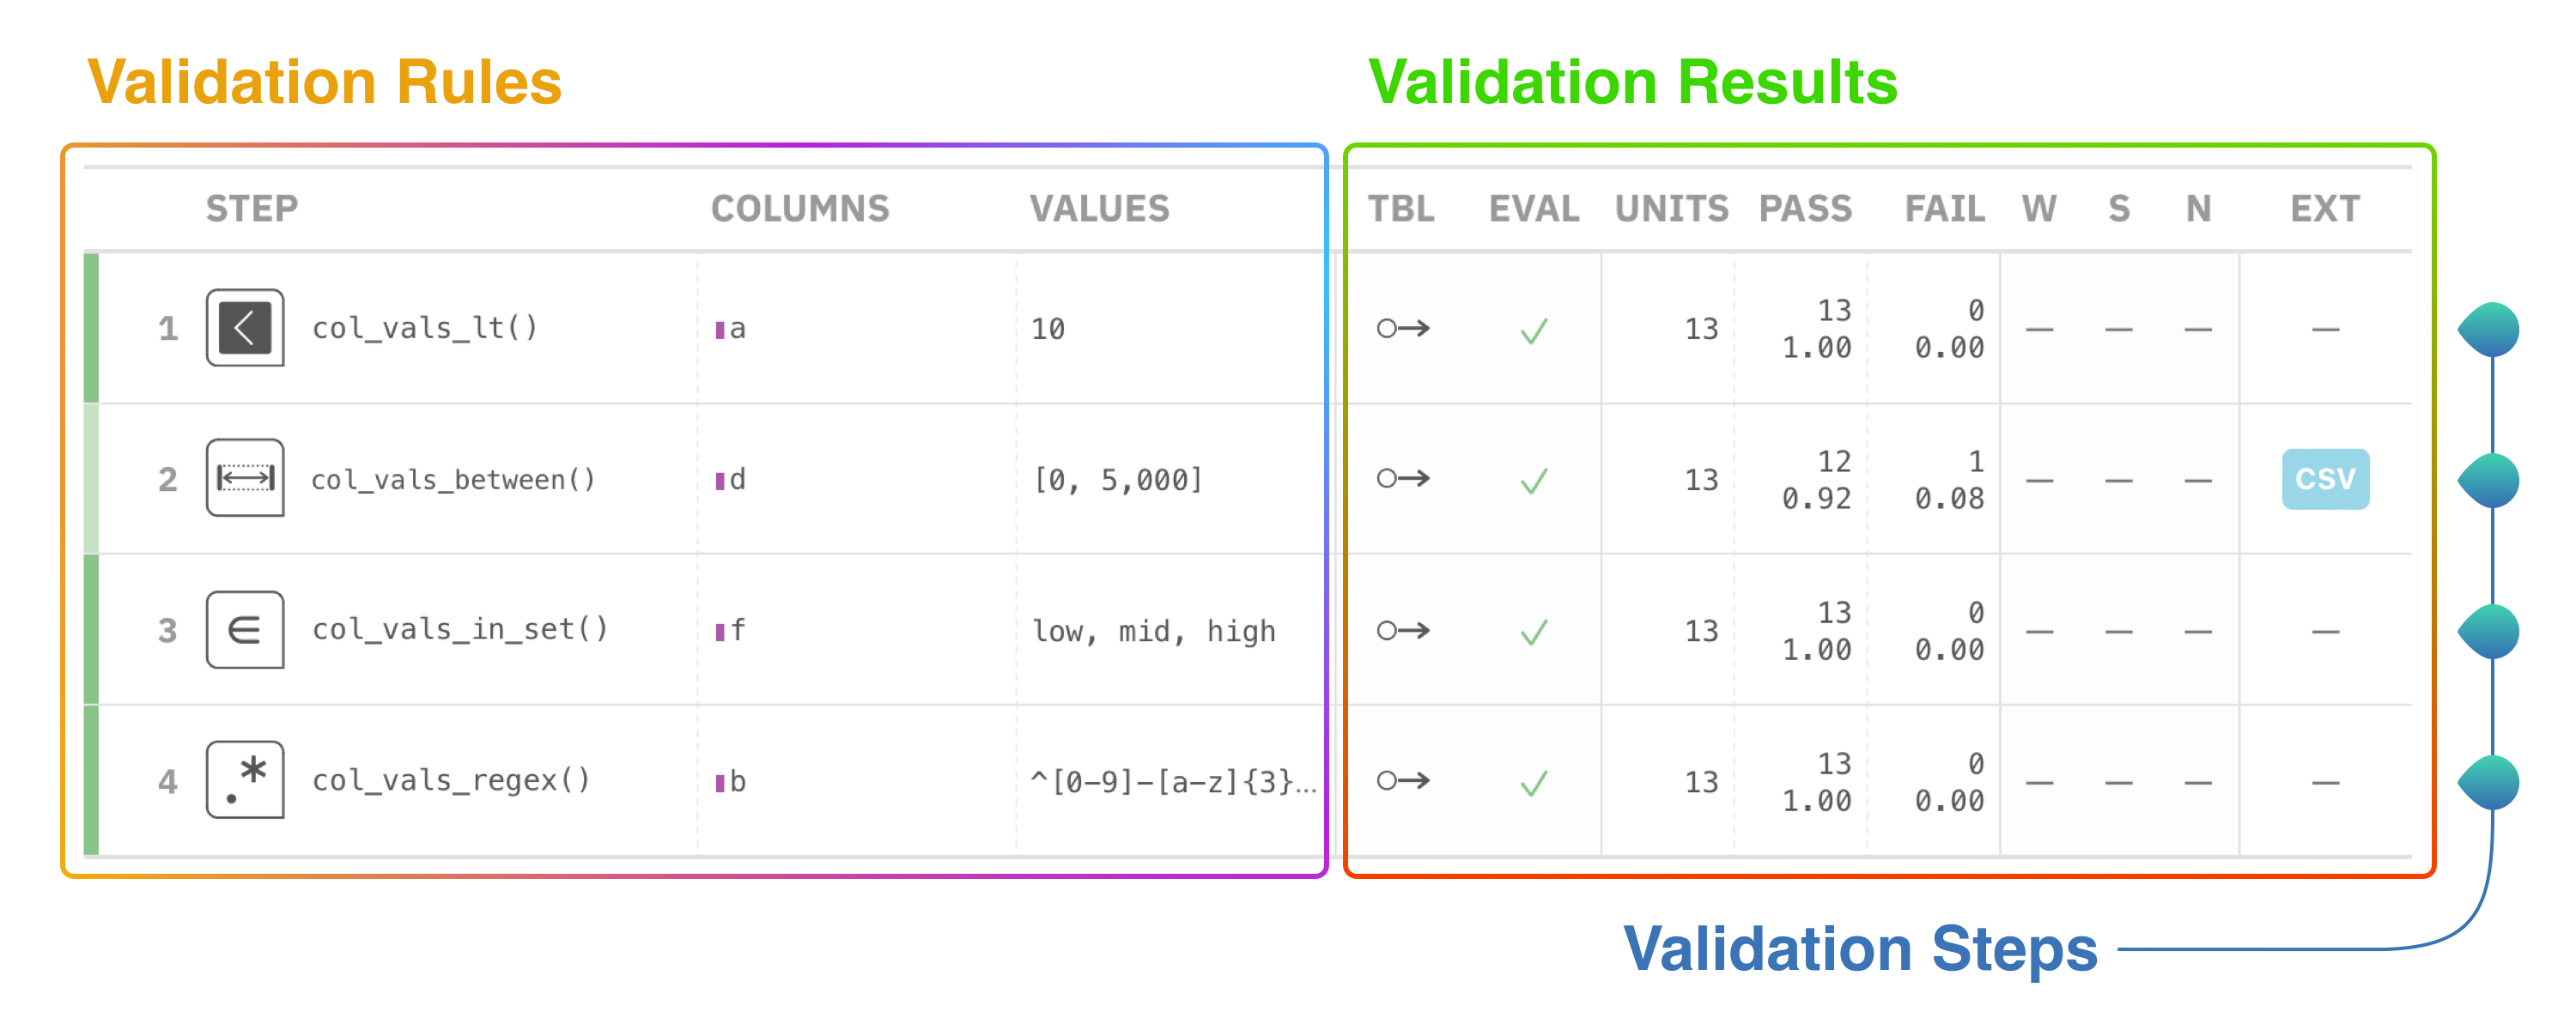
There are three things that should be noted here:
- Validation steps: each step is a separate test on the table, focused on a certain aspect of the table.
- Validation rules: the validation type is provided here along with key constraints.
- Validation results: interrogation results are provided here, with a breakdown of test units (total, passing, and failing), threshold flags, and more.
The intent is to provide the key information in one place, and have it be interpretable by data stakeholders.
Example Code, Step-by-Step
Here’s the code that performs the validation on the data frame.
agent <- small_table %>%
  create_agent() %>%
  col_vals_lt(a, value = 10) %>%
  col_vals_between(d, left = 0, right = 5000) %>%
  col_vals_in_set(f, set = c("low", "mid", "high")) %>%
  col_vals_regex(b, regex = "^[0-9]-[a-z]{3}-[0-9]{3}$")

agent %>%
  interrogate()
Note these three key pieces in the code:
- The
create_agent()function takes a data frame or database table that you want to validate. - The functions starting with
col_*specify validation steps that run on specific columns. - The
interrogate()function executes the validation plan on the target table and returns the validation table.
This common pattern is used in a validation workflow, where
create_agent() and interrogate() bookend a
validation plan generated through calling validation methods. And that’s
data validation with pointblank in a nutshell! In the next section we’ll
go a bit further by understanding how we can measure data quality with
test units and failure thresholds.
Understanding Test Units
Each validation step will execute a type of validation test on the
target table. For example, a col_vals_lt() validation step
can test that each value in a column is less than a specified number.
The key finding that’s reported as a result of this test is the number
of test units that pass or fail.
Test units are dependent on the test being run. The collection of
col_vals_* validation methods will test each and every
value in a particular column, so each value will be a test unit (and the
number of test units is the number of rows in the target table). Some
validation methods like col_exists() or
row_count_match() have only a single test unit since they
aren’t testing individual values but rather if a single condition is
true or false.
Using Action Levels
Knowing about the numbers of test units across validation methods matters because you have the option to set action levels (that can signal ‘warn_at’, ‘stop_at’, and ‘notify_at’ flags) based on either the relative proportion or absolute number of failing test units.
al <- action_levels(warn_at = 2, stop_at = 4)

small_table %>%
  col_vals_lt(a, value = 7, actions = al)
#> Warning: Exceedance of failed test units where values in `a` should have been < `7`.
#> The `col_vals_lt()` validation failed beyond the absolute threshold level (2).
#> * failure level (2) >= failure threshold (2)
#> # A tibble: 13 × 8
#>    date_time           date           a b             c      d e     f
#>    <dttm>              <date>     <int> <chr>     <dbl>  <dbl> <lgl> <chr>
#>  1 2016-01-04 11:00:00 2016-01-04     2 1-bcd-345     3  3423. TRUE  high
#>  2 2016-01-04 00:32:00 2016-01-04     3 5-egh-163     8 10000. TRUE  low
#>  3 2016-01-05 13:32:00 2016-01-05     6 8-kdg-938     3  2343. TRUE  high
#>  4 2016-01-06 17:23:00 2016-01-06     2 5-jdo-903    NA  3892. FALSE mid
#>  5 2016-01-09 12:36:00 2016-01-09     8 3-ldm-038     7   284. TRUE  low
#>  6 2016-01-11 06:15:00 2016-01-11     4 2-dhe-923     4  3291. TRUE  mid
#>  7 2016-01-15 18:46:00 2016-01-15     7 1-knw-093     3   843. TRUE  high
#>  8 2016-01-17 11:27:00 2016-01-17     4 5-boe-639     2  1036. FALSE low
#>  9 2016-01-20 04:30:00 2016-01-20     3 5-bce-642     9   838. FALSE high
#> 10 2016-01-20 04:30:00 2016-01-20     3 5-bce-642     9   838. FALSE high
#> 11 2016-01-26 20:07:00 2016-01-26     4 2-dmx-010     7   834. TRUE  low
#> 12 2016-01-28 02:51:00 2016-01-28     2 7-dmx-010     8   108. FALSE low
#> 13 2016-01-30 11:23:00 2016-01-30     1 3-dka-303    NA  2230. TRUE  high
Here we set a threshold of 2 failed units for a warning
and 4 for an error. You can set the action levels for
individual validation rules via the actions argument. If
you set it while creating the agent, it applies to all rules in a
validation plan.
small_table %>%
  create_agent(actions = al) %>%
  col_vals_lt(a, value = 7) %>%
interrogate()If you look at the validation report table, we can see:
- The
FAILcolumn shows that 2 tests units have failed. - the
Wcolumn (short for ‘warning’) shows a filled yellow circle indicating those failing test units reached that threshold value. - the
Scolumn (short for ‘stop’) shows an open red circle indicating that the number of failing test units is below that threshold.
The one final action level, N (for ‘notify’), wasn’t set
so it appears on the validation table as a long dash.
Setting thresholds is important since you might want some sort of signal for the discovery of errors in your data. How you set the particular threshold levels is highly dependent on your tolerance for data failures.